Dormant BTC activity fell to its lowest level since Q3 2022, suggesting long-term holders have slowed distribution after heavy profit-taking.

 Live Chat

Dormant BTC activity fell to its lowest level since Q3 2022, suggesting long-term holders have slowed distribution after heavy profit-taking.

The cryptocurrency market finds itself in a peculiar position where calmness masks potential turbulence. As
The crypto market has gone quiet. After a brutal stretch of selling pressure, major digital assets — Shiba Inu, Cardano, and XRP — have all compressed into tight trading ranges that traders know well. Too well, actually. That kind of stillness rarely lasts. Buyers and sellers are basically in a standoff right now, and the market is waiting on something — anything — to break the deadlock and pick a direction.
It’s not just a vague feeling. The technical picture across these three assets is pretty much the same story: reduced volatility following heavy selling, narrow price bands, and no clear catalyst in sight. That combination tends to mean one thing in crypto. A big move is probably coming. Nobody knows which way.
We’ve been here before. Late 2018 is the obvious parallel — Bitcoin and the broader market spent months grinding sideways after the wreckage of the 2017 bull run. Volatility dropped, volume dried up, and a lot of people called it dead. Then 2019 happened. The breakout came, and the next cycle started building from exactly that kind of low-energy base.
Mid-2021 is another one worth remembering. After Bitcoin’s initial surge earlier that year, the market hit a consolidation wall. Months of stagnation followed. And then, gradually, recovery. A new all-time high came after that. The pattern isn’t guaranteed to repeat — crypto doesn’t work that cleanly — but the setup rhymes. Calm stretches in this market have a habit of ending loudly.
So when Shiba Inu, Cardano, and XRP all start flashing compressed volatility at the same time, it’s probably worth paying attention. Maybe it goes nowhere for another few weeks. Maybe it doesn’t.
For anyone holding Shiba Inu or Cardano right now, the consolidation is a double-edged thing. On one hand, it’s a window — a chance to reassess positions before the next significant move forces a decision under pressure. On the other hand, the longer this drags on, the more fragile sentiment gets. New money tends to stay on the sidelines when direction is this murky, and that can become a self-reinforcing problem.
XRP’s situation is a bit different and, honestly, more concerning. Its volatility has dropped to levels that some traders describe as dangerously low. That kind of near-zero movement can mean two things: either the market has basically lost interest in the asset, or pressure is quietly building under the surface before a sharp move. The difference between those two outcomes is enormous. One path leads to what some have started calling “zombie asset” territory — low volume, low relevance, slow fade. The other leads to a breakout that resets the narrative entirely.
The stakes aren’t small. Whichever direction these assets break, it’ll create winners and losers fast. Complacency in a setup like this tends to be expensive.
A few things are worth tracking closely over the next month.
The volatility index for crypto over the next 30 days is the first one. A sharp spike there would likely signal the start of something bigger — not just for these three assets, but for the broader market.
Shiba Inu’s resistance levels are the second. The asset is sitting below three key resistance points. Breaking through all of them would be a meaningful signal — not just for Shiba Inu holders, but as a read on overall market confidence. It won’t be easy. But it’s the kind of move that tends to pull other assets along with it.
XRP’s trading volume is the third. Sustained low volume over the coming weeks could cement the “zombie asset” label in the eyes of the market. That’s not just a technical problem — it raises real questions about XRP’s utility and liquidity going forward. If volume doesn’t return, the perception problem becomes a real one.
And it’s worth watching Cardano’s ability to claw back recovery ground. Cardano’s trajectory right now depends heavily on external catalysts — macro shifts, broader risk appetite, or a sentiment flip somewhere in the market. Without one of those, the stagnation probably continues.
The interplay between these signals and investor behavior will be pretty telling. Right now, market participants are watching the same charts, waiting on the same triggers. The pressure is building on all sides. Shiba Inu needs to clear resistance. Cardano needs a reason to move. XRP needs volume to come back before the dormancy narrative sticks for good.
Hub: Cardano price, news, and analysis
The next 30 days will probably tell us a lot. Volatility this low doesn’t stay this low — not in crypto, not for long.
Post Views: 13

The Ethereum Foundation (EF) announced on Apr. 8 that it would convert 5,000 ETH into stablecoins through CoWSwap’s TWAP feature to fund research, grants, and donations.
The announcement reopened a debate over what the foundation’s treasury overhaul was ever meant to accomplish. Over the last year, EF moved treasury assets into DeFi, borrowed against ETH collateral, and then launched a staking initiative centered on about 70,000 ETH.
The reality described in EF’s June 2025 treasury policy suggested a different model. It tied monetization to a fiat-denominated operating buffer and kept ETH sales, staking, and stablecoin borrowing inside the same treasury framework.
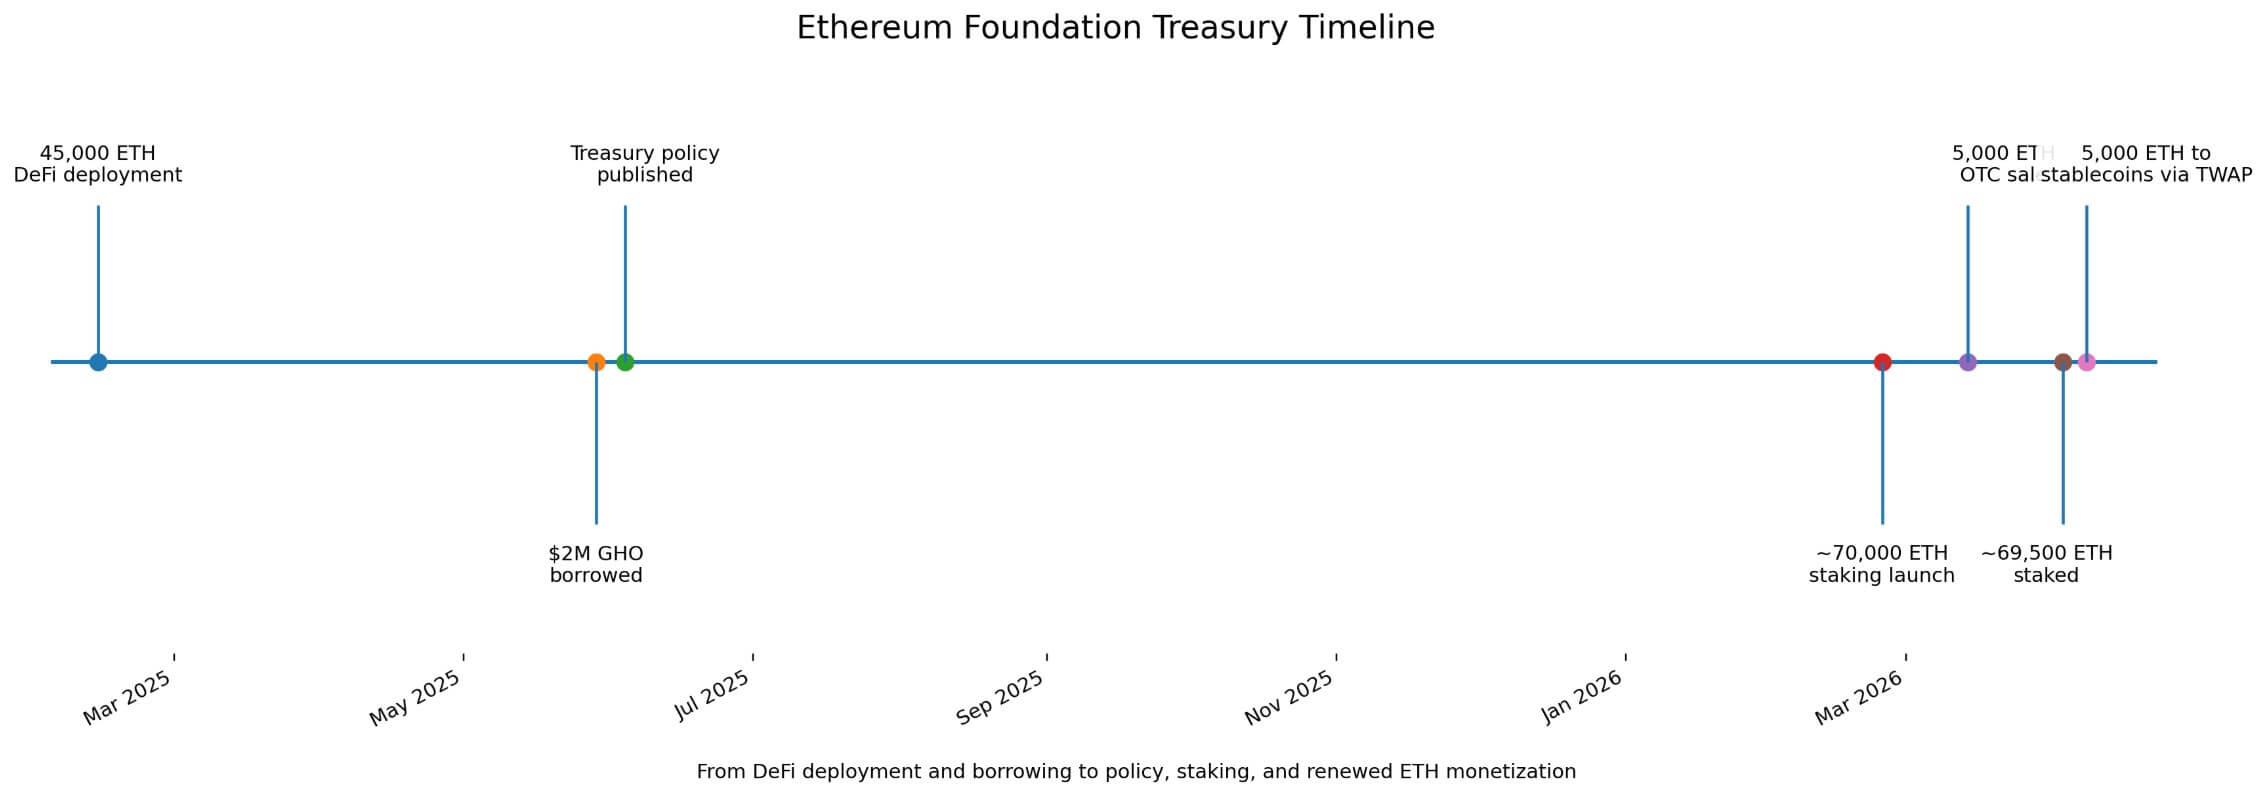
On Feb. 13, 2025, EF Treasury said it had deployed 45,000 ETH across Spark, Aave Prime, Aave Core, and Compound. On May 29, it borrowed $2 million in GHO against its Aave position.
The move carried symbolic weight because it showed EF using DeFi rails to raise working capital without selling spot ETH.
By early April, that interpretation had filtered into retail discourse, as a Reddit post argued that EF was “no longer selling.” One commenter replied that “it’s good that they stopped selling.”
Despite anecdotal evidence, this kind of chatter shows how the stronger version of the thesis had already entered circulation before EF announced the Apr. 8 conversion.
As EF launched its staking initiative on Feb. 24, it said it would stake 70,000 ETH, with rewards routed back to the treasury.
On Mar. 14, it finalized a 5,000 ETH OTC sale to BitMine at an average price of $2,042.96. On Apr. 3, on-chain activity pushed the staked total to roughly 69,500 ETH, close to the target. Then came the Apr. 8 CoWSwap conversion, highlighting that selling and staking had already been operating side by side for weeks.
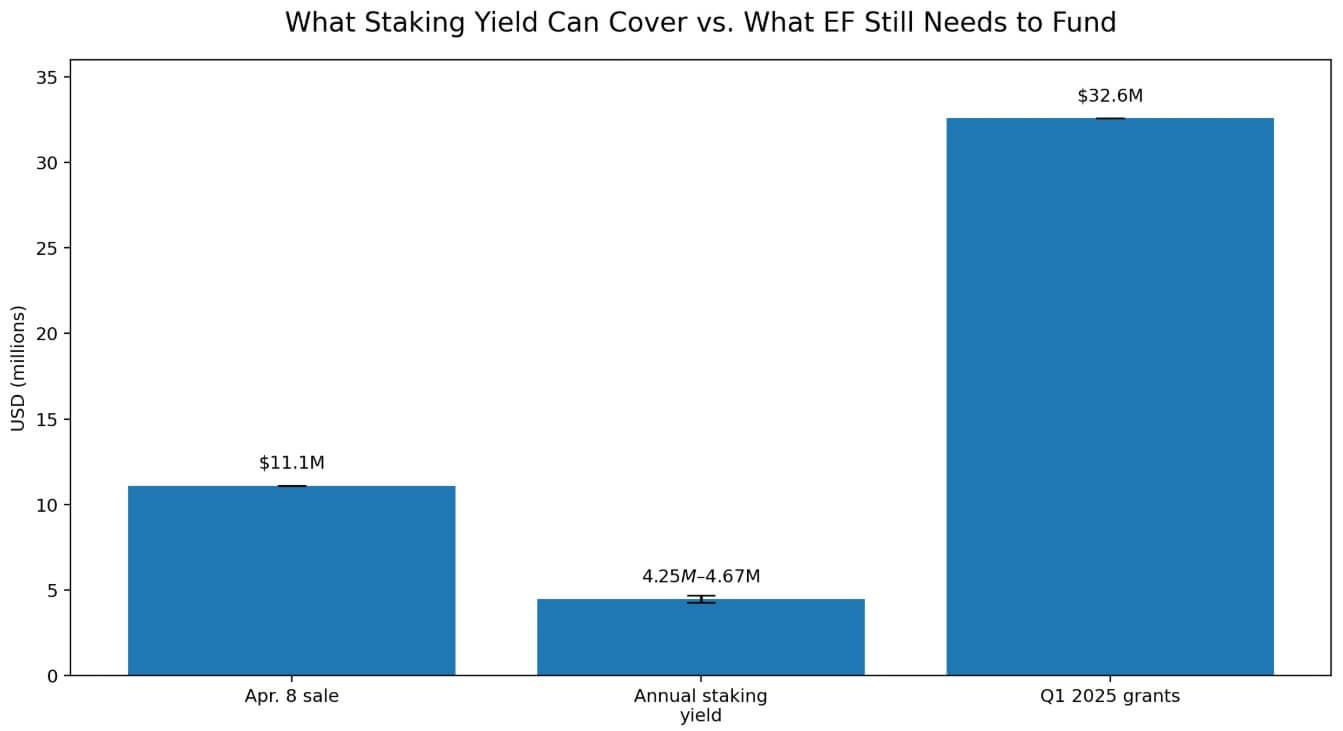
At an ETH price around $2,220.76, a 5,000 ETH conversion equals about $11.1 million, while ETH staking reference rates in early April sat around 2.73% to 3.00%.
Applied to 70,000 ETH, that produces roughly 1,912 to 2,102 ETH a year, worth about $4.25 million to $4.67 million at current prices. A single 5,000 ETH sale equals about 2.4 to 2.6 times the full-year yield from the entire 70,000 ETH staking sleeve.

The staking program improves treasury efficiency and reduces funding requirements, but it remains well below the scale needed to replace treasury sales.
The EF June 2025 framework set annual opex at 15% of treasury and the operating buffer at 2.5 years, which implies a fiat-denominated reserve equal to 37.5% of treasury.
Applied only as an illustration to EF’s last full treasury snapshot, the Oct. 31, 2024, report showed $970.2 million in total treasury and $181.5 million in non-crypto assets, implying a policy target reserve of about $363.8 million.
EF had already publicly added stablecoin exposure after that snapshot, deploying 2,400 ETH and about $6 million in stablecoins into Morpho in October 2025, and it later announced additional ETH-to-stablecoin conversions in October 2025 and April 2026.
The exact current size of EF’s fiat-like bucket and whether tokenized RWA holdings have already been added in material size are still unknown. So the 2024 snapshot should still be treated as illustrative rather than as a stand-in for today’s balance sheet.
EF’s own allocation update showed $32.6 million in grants for the first quarter of 2025. At today’s ETH price, that equals roughly 14,700 ETH. The Apr. 8 conversion covers only about 33% of that quarter’s grant total, excluding protocol research, staffing, operations, and broader industry support.
Yield and borrowing leave the fiat-denominated budget intact and still require periodic monetization.
The bull case for EF rests on straightforward treasury arithmetic, as a higher ETH price and a lower long-run opex ratio would allow the foundation to maintain its dollar buffer while monetizing fewer coins.
| Scenario | What changes | Likely treasury effect |
|---|---|---|
| Bull case | ETH price rises, long-run opex ratio falls | Fewer coins need to be sold to maintain fiat buffer |
| Base case | Mixed strategy continues | Staking, DeFi, borrowing, and periodic sales coexist |
| Bear case | ETH price weakens, spending pressure rises | More ETH may need to be monetized to preserve runway |
| Key implication | Reserve target stays fiat-denominated | “Less selling” narrative breaks down if ETH falls |
In that setting, staking rewards and selective borrowing can reduce quarterly sales and give EF more flexibility around venue choice, whether through OTC blocks, TWAP execution, or conservative DeFi positions.
Treasury modernization would then show up in lower cadence, smaller clips, and better execution.
The bear case runs through the same framework in reverse, as EF’s reserve target is denominated in fiat terms.
A weaker ETH price can force more monetization to preserve runway, especially if the foundation leans into its counter-cyclical mandate and spends more aggressively during harder market conditions.
Under that setup, a large staking sleeve still generates yield, but the reserve requirement can rise faster than that yield offsets it.
Public expectations built around “less selling” then collide with the balance-sheet discipline EF had already written into policy.
The Apr. 8 conversion brought that discipline back into view. EF’s treasury strategy had already combined DeFi deployment, stablecoin borrowing, staking, and periodic ETH sales.
The market narrative extended beyond the written policy and beyond the foundation’s own post-staking transaction record.
The bitcoin mining industry is undergoing the most fundamental transformation in its history, and the clearest sign isn’t the hashrate or the difficulty adjustments. It’s the balance sheets.
CoinShares’ Q1 2026 mining report, published this week, reveals that the weighted average cash cost to produce one bitcoin among publicly listed miners rose to approximately $79,995 in Q4 2025.
Bitcoin has traded in the $68,000 to $70,000 band, with a CoinDesk report last week estimating losses of $19,000 per BTC mined.
These numbers aren’t sustainable, and the industry knows it. The response has been a wholesale pivot toward artificial intelligence infrastructure that is reshaping what these companies actually are.
Over $70 billion in cumulative AI and high-performance computing contracts have now been announced across the public mining sector, according to the CoinShares report. CoreWeave’s expanded deal with Core Scientific alone is worth $10.2 billion over 12 years. TeraWulf has $12.8 billion in contracted HPC revenue. Hut 8 signed a $7 billion, 15-year lease for AI infrastructure at its River Bend campus. Cipher Digital has a multi-billion-dollar agreement with Google-backed Fluidstack.
Listed miners could derive as much as 70% of their revenue from AI by the end of 2026, up from roughly 30% today. Core Scientific’s AI colocation revenue already accounts for 39% of its total. TeraWulf is at 27%. IREN is at 9% and scaling rapidly with up to 200 megawatts of liquid-cooled GPU capacity under construction.
That means these mining companies are increasingly becoming data center operators that happen to still mine bitcoin on the side.
The economics explain why. According to CoinShares, the cost differential between bitcoin mining infrastructure at roughly $700,000 to $1 million per megawatt and AI infrastructure at $8 million to $15 million per megawatt is wide, but AI offers structurally higher and more stable returns.
Hash price, the metric that determines miner revenue per unit of computing power, hit an all-time post-halving low of roughly $28 to $30 per petahash per day in early March.
At those levels, miners running mid-generation hardware need access to electricity below $0.05 per kilowatt-hour to remain cash-profitable. Meanwhile, AI infrastructure contracts promise margins above 85% with multi-year revenue visibility.
The transition is being financed in two ways, and both are visible in the data, the report explained.
First, debt. The sector’s aggregate leverage has fundamentally changed. IREN now carries $3.7 billion in convertible notes across five series. TeraWulf has $5.7 billion in total debt, split between convertible notes and senior secured notes at its compute subsidiary.
Cipher Digital issued $1.7 billion in senior secured notes in November, causing its quarterly interest expense to surge from $3.2 million for the first nine months to $33.4 million in Q4 alone. These are not mining-scale debt loads. These are infrastructure-scale bets that the AI revenue will materialize fast enough to service the obligations.
Second, bitcoin sales. Publicly listed miners have collectively reduced their BTC treasuries by over 15,000 BTC from peak levels. Core Scientific sold roughly 1,900 BTC worth $175 million in January and is planning to liquidate substantially all remaining holdings in Q1 2026. Bitdeer reduced its treasury to zero in February. Riot Platforms sold 1,818 BTC worth $162 million in December.
Even Marathon, the largest public holder at 53,822 BTC, quietly expanded its policy in its March 10-K filing to authorize sales from its entire balance sheet reserve, partly driven by pressure on its $350 million bitcoin-backed credit facility where the loan-to-value ratio climbed to 87% as prices fell toward $68,000.

The miners that are selling bitcoin to fund AI buildouts are the same companies whose mining operations secure the bitcoin network. That creates a tension at the heart of the transition. When mining is unprofitable and AI is lucrative, the rational economic decision is to reallocate capital away from mining. But if enough miners do that, the network’s security budget shrinks.
The hashrate data already reflects this. The network peaked at approximately 1,160 exahashes per second in early October 2025 and has since declined to roughly 920 EH/s, with three consecutive negative difficulty adjustments, the first such streak since July 2022.
The valuation market has already priced the bifurcation. Miners with secured HPC contracts now trade at 12.3 times next-twelve-month sales. Pure-play miners trade at 5.9 times. The market is paying more than double for the AI exposure, which reinforces the incentive to pivot further.
The geographic picture is shifting alongside the economics, meanwhile. The United States, China, and Russia now control roughly 68% of global hashrate. The U.S. gained about 2 percentage points of market share in Q4 alone.
But emerging markets are entering the picture. Paraguay and Ethiopia have joined the global top 10 mining countries, driven by HIVE’s 300-megawatt operation in Paraguay and Bitdeer’s 40-megawatt facility in Ethiopia.
CoinShares forecasts the network hashrate will reach 1.8 zetahashes by the end of 2026 and 2 zetahashes by end of March 2027, one month later than previously predicted.
But that forecast depends on bitcoin recovering to $100,000 by year-end. If prices stay below $80,000, CoinShares expects hash price to continue falling and the hashrate to decline further as more miners exit.
A sustained move below $70,000 could trigger larger capitulation that, paradoxically, benefits survivors through lower difficulty.
Next-generation hardware offers a potential lifeline. Bitmain’s S23 series and Bitdeer’s proprietary SEALMINER A3, both operating below 10 joules per terahash, are expected at scale through the first half of 2026. These machines would roughly halve the energy cost per bitcoin compared to current mid-generation fleets. But deploying them requires capital that many miners are directing toward AI instead.
The bitcoin mining industry entered this cycle as a group of companies that secured the network and accumulated bitcoin. It is exiting as a group of companies that build AI data centers and sell bitcoin to fund them.
Whether that’s a temporary response to unfavorable economics or a permanent structural shift depends on one variable: the price of bitcoin. If it returns to $100,000, mining margins recover and the AI pivot slows. If it stays at $70,000 or below, the transition accelerates and the mining sector as it existed for the past decade continues to disappear into something else entirely.
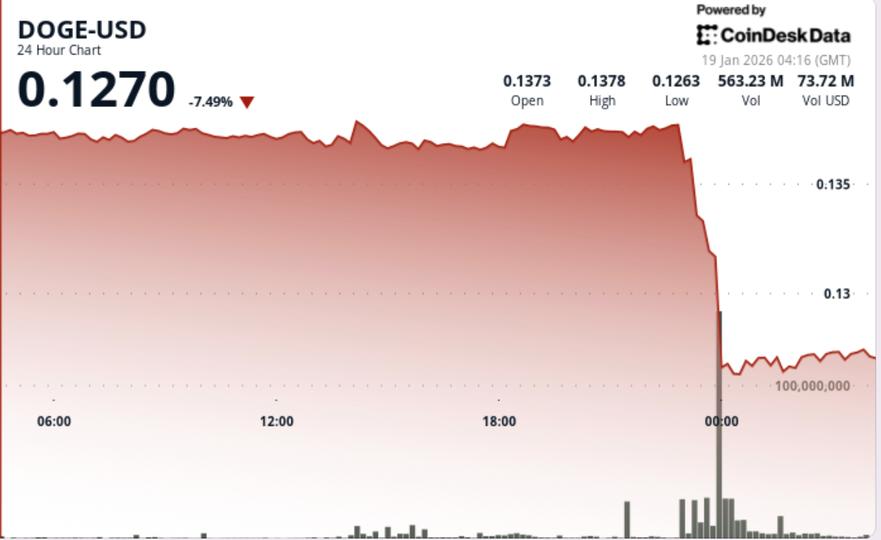
Traders are watching $0.127 as near-term support, with $0.137 now the key level DOGE must reclaim to stabilize.

Historical data shows that nearly every large transfer from Mt. Gox has negatively affected bitcoin’s price.
Bitcoin (BTC) has been under a lot of pressure recently, with its price dropping to levels not seen since mid-April 2025. Amid the persistent negative trend, one of the largest holders of BTC had executed a major transfer that is capable of shaking the market further.
According to a tweet by Lookonchain, the estate trustee of the defunct cryptocurrency exchange Mt. Gox has moved approximately $1 billion in BTC within the last 24 hours. With the market already bleeding, the latest Mt. Gox transfer raises the question of whether BTC will buckle under intensifying selling pressure and decline further.
The last time Mt Gox made a significant transfer was eight months ago, on March 25. CryptoPotato reported at the time that the entity moved 11,501 BTC, worth over $1.01 billion, from its cold wallet to two addresses. Following that transaction were two others worth more than $77 million each.
Since then, the cold wallet holding the defunct estate’s bitcoins has remained nearly dormant, only executing transactions worth less than $300 at a go. About seven hours before press time, the wallet suddenly moved 10,608 BTC worth no less than $953.66 million. A subsequent transaction from the wallet moved $16.8 million worth of bitcoins to another address.
In total, Mt. Gox has moved 10,793 BTC, worth $970.46 million, to two different addresses. The cold wallet still held $3.16 billion in BTC at press time.
Based on historical data, large Mt. Gox transfers have consistently preceded significant sell-offs. This is because the defunct exchange’s creditors tend to offload their assets soon after repayments are made.
Over a decade after its collapse, Mt. Gox began repaying creditors in July 2024. Although the payments were scheduled to be concluded last month, the entity announced that it was moving the deadline to October 2026. The estate trustee cited incomplete procedures as a reason for the change in plans. This means the Bitcoin market will witness more large transfers from wallets tied to the defunct entity in the coming months.
Mt. Gox may only be conducting some internal shuffling arrangements for the ongoing repayments, rather than immediately dumping the assets. However, past data shows that nearly every large transfer from the entity has led to a significant plunge in bitcoin’s price.
Data from CoinMarketCap shows that BTC has tumbled over 6.6% from $95,000 to $89,300. Although the asset had rebounded to $91,000 at the time of writing, Bitcoin moves from wallets tied to Mt Gox could trigger a deeper correction.

Timothy Morano
Oct 19, 2025 07:57
Hedera (HBAR) trades near $0.16 support level with RSI at 33.98, suggesting potential oversold bounce as token approaches critical technical inflection point amid broader market weakness.
• HBAR trading at $0.16 (down 0.5% in 24h)
• No major catalysts driving price action in past week
• Token testing lower Bollinger Band support zone
• Following Bitcoin’s bearish momentum with broader crypto selloff
Trading on technical factors in absence of major catalysts, HBAR price has declined modestly over the past 24 hours as the broader cryptocurrency market faces selling pressure. No significant news events have emerged in the past week that would directly impact Hedera’s price trajectory, leaving technical analysis as the primary driver for short-term movements.
The current HBAR price action reflects the broader risk-off sentiment across digital assets, with Bitcoin’s continued weakness weighing on altcoin performance. Market participants appear to be de-risking positions ahead of potential macroeconomic developments, creating a challenging environment for most cryptocurrency projects including Hedera.
Hedera technical analysis reveals HBAR currently trading below all major moving averages, with the token sitting at $0.16 compared to the 7-day SMA of $0.18 and 20-day SMA of $0.20. The current positioning suggests continued bearish momentum in the near term, though the proximity to the lower Bollinger Band at $0.15 indicates potential oversold conditions.
Trading volume on Binance spot market of $12.6 million remains moderate, suggesting institutional interest has not dramatically shifted despite the recent price weakness. The token’s position relative to its 52-week range shows HBAR trading closer to annual lows of $0.13 than highs of $0.29.
The RSI reading of 33.98 places HBAR in neutral territory but approaching oversold conditions, which historically has provided bounce opportunities for the token. The MACD histogram at -0.0032 confirms bearish momentum remains intact, though the divergence between MACD (-0.0154) and signal line (-0.0123) is narrowing.
Bollinger Band positioning shows HBAR with a %B reading of 0.1653, indicating the token trades near the lower band support level. This technical setup often precedes either a bounce back toward the middle band or a breakdown below support if selling pressure intensifies.
• Resistance: $0.18 (7-day moving average and immediate technical hurdle)
• Support: $0.15 (lower Bollinger Band and psychological level)
A breakdown below $0.15 support could accelerate selling toward the strong support zone at $0.07, representing a significant downside risk for HBAR holders. Conversely, a reclaim of $0.18 resistance would target the 20-day moving average at $0.20, offering a potential 25% upside from current levels.
Bitcoin’s continued weakness has maintained pressure on HBAR price, with the token following the broader cryptocurrency market’s risk-off sentiment. While traditional market correlations remain muted in the absence of significant macroeconomic catalysts, the general cryptocurrency sector weakness continues to weigh on Hedera’s price performance.
The correlation with Bitcoin remains positive but has shown signs of weakening as HBAR approaches technical support levels that could provide independent buying interest regardless of broader market conditions.
A successful defense of the $0.15 lower Bollinger Band support, combined with RSI approaching oversold territory, could trigger a relief rally toward $0.18-$0.20 resistance zone. Improving Bitcoin sentiment would likely amplify any HBAR price recovery.
Failure to hold $0.15 support on increased volume would likely accelerate selling pressure toward the $0.13 annual low and potentially the strong support at $0.07. Continued Bitcoin weakness would exacerbate downside pressure.
Conservative traders should consider stop-losses below $0.14 to limit downside exposure, while aggressive buyers might accumulate near current levels with tight risk management given the proximity to technical support. Position sizing should account for the elevated volatility indicated by the 14-day ATR of $0.02.
Image source: Shutterstock
Last week’s massive crypto crash didn’t just hit traders, it also wiped out millions in stolen funds held by hackers who, caught in the panic, misplayed the market with disastrous timing.
Blockchain sleuth Lookonchain has tracked at least six wallets linked to known hackers that lost more than $13.4 million after panic-selling ether during the downturn.
The hackers in question appear to be part of a group of cybercriminals who have recently engaged in cryptocurrency theft. The mention of “6 hacker wallets” losing over $13.4 million suggests a coordinated effort, possibly linked to a known hacking syndicate.
The sell-off began when one wallet offloaded 7,816 ETH at $3,728 per coin, a move that coincided with the steepest part of the crash. As prices dropped further, five more wallets followed suit, contributing to the broader market dump.
However, rather than holding the sold assets in stablecoins or attempting to launder the ETH, the hackers rebought the same amount — 7,816 ETH — at $4,159 as the markets bounced back, locking in another round of losses.
By Oct. 18, blockchain analysis revealed that the total loss from these trading missteps reached $13.4 million.
Given the scale of the funds (about $29 million in the latest transaction alone), these hackers are likely sophisticated actors with access to advanced tools for exploiting vulnerabilities in decentralized finance (DeFi) protocols, exchanges, or smart contracts.
The hackers’ trading patterns during volatile market conditions suggest that while they’re experienced in exploiting the ecosystem’s players, they react to market swings like any other over-leveraged trader would: with poor timing and emotional decision-making.
Lookonchain labeled the behavior as “panic selling,” while some crypto observers even joked that the attackers might be “great hackers, terrible traders.”
However, the hackers likely acquired those funds through hacking. So while the losses are real, the funds were likely not earned but stolen.
Blockchain analysts believe the ETH originated from earlier attacks, meaning the hackers were trading with assets they hadn’t bought in the first place.
In that sense, the losses may not hurt in the way they would for ordinary traders.
Think of it this way: someone finds a suitcase of cash, gambles it poorly, and walks away empty-handed. They’re worse off than before but not out-of-pocket, since the money they lost wasn’t theirs in the first place.
Maybe the hacker group should’ve just stuck with hacking and maybe start looking for a portfolio manager for criminals. Still, the missteps reveal something about the current state of the crypto landscape. Even sophisticated attackers can falter under pressure.
There’s another possibility out there. While they were ‘terrible traders’, they may also have been laundering their ill-gotten gains through these trades, strategically dumping tainted funds during the panic to then buy back clean funds, even if at a loss.
As one X poster said, “It’s a form of money laundering. While they are puking, on the other side, they are buying. Then they reverse after it rises. Loose the stolen money, earn on fresh money.”
The Oct. 10 market correction affected traders across the board, triggered by a combination of macroeconomic pressures and thinning liquidity in decentralized markets that led to a $500 billion slump.
While hacks and exploits are usually viewed in isolation, last week’s developments show how on-chain markets, by design, apply the same rules to everyone: whether they’re retail traders, whales, or hackers.

Altcoins have not quite recovered from the significant downturn that hit the financial markets a week ago. Most large-cap cryptocurrency assets, including Bitcoin, are either revisiting their low from the previous week or struggling to mount any real pressure from their current position.
For instance, the largest altcoin by market cap, Ethereum, after briefly returning to above $4,200 earlier this week, is back to its level in the aftermath of the October 10th bloodbath. According to the latest on-chain data, it appears that investors are increasingly losing confidence in the long-term promise of the altcoins.
In a new post on X, CryptoQuant’s Head of Research, Julio Moreno, revealed that altcoins are making their way in large volumes to centralized exchanges. This fresh trend reflects a less optimistic shift in investor sentiment after a particularly positive start to the month of October.
The relevant indicator here is the Exchange Inflow Transaction Count, which measures the number of transactions involving the deposit of a cryptocurrency (altcoins, in this context) into a centralized exchange. This metric can be used to assess investor sentiment at every given moment in the market.
A significant rise in the Exchange Inflow Transaction is typically considered a bearish signal, as it suggests that investors are moving their assets to centralized exchanges to sell. Ultimately, this trend could mean imminent selling pressure for the cryptocurrency (or group of digital assets, as in this case).
Moreno revealed in his post on X that the number of transactions sending altcoins onto trading platforms has reached a new high in 2025. As observed in the chart below, the world’s largest cryptocurrency exchange by trading volume, Binance, has been responsible for the majority of the cryptocurrencies flowing into these centralized platforms.
While the market already seems to be undergoing a significant correction, a continuous flow of assets into exchanges could mean an extended period of downward movement for the altcoins. However, the peak of this metric could also be significant, as it could signal the bottom and potential reversal of the altcoin market.
According to the latest data, the cryptocurrency market (excluding Bitcoin) is valued at around $1.45 trillion, reflecting an over 1% drop in the past 24 hours. What’s more worrying is the market’s record in the past week, as the altcoins have lost nearly 13% of their value over the last seven days.
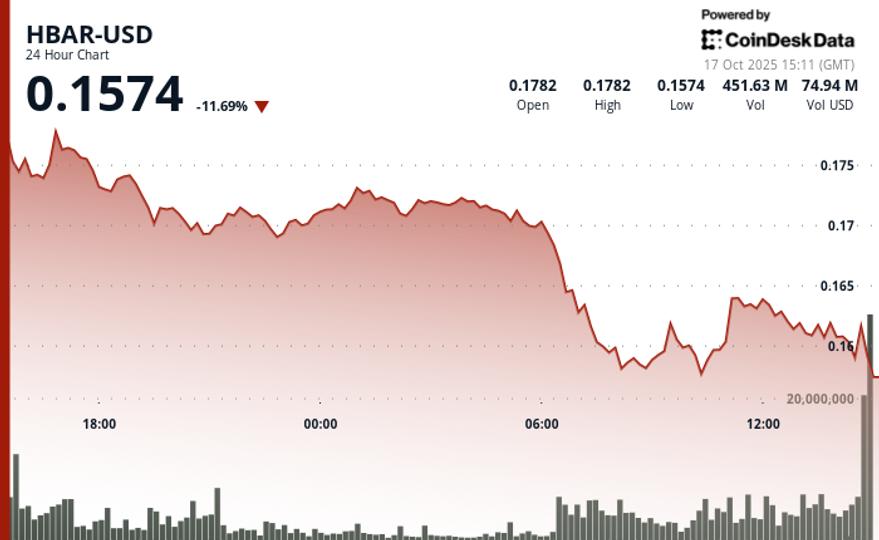
HBAR fell sharply over the 24-hour period from Oct. 16 at 15:00 to Oct. 17 at 14:00, dropping from $0.18 to $0.16 — an 11.15% decline within a 12.74% trading range.
The heaviest selling occurred between 06:00 and 08:00 on October 17, when the price fell from $0.17 to $0.16 on strong volume. Resistance formed at $0.17, while repeated rebounds near $0.16 established firm support despite a continued bearish pattern of lower highs.
In the final hour of trading, HBAR showed high volatility around the $0.16 mark, recovering briefly after a steep dip between 13:43 and 13:47. Trading volume surged above 4 million during this rebound, suggesting temporary stabilization at key support levels.
The decline reflected broader market weakness, with selling pressure intensifying across the digital asset space. Despite short-term recovery efforts, HBAR remains under downward pressure, indicating that consolidation within the $0.16 range may precede any potential reversal.
Disclaimer: Parts of this article were generated with the assistance from AI tools and reviewed by our editorial team to ensure accuracy and adherence to our standards. For more information, see CoinDesk’s full AI Policy.


