Bitcoin trades near $65,978, below the $69,000 level Glassnode treats as the average cost basis for short-term holders, and the Federal Reserve’s July 28-29 meeting will decide if this disconnect can be closed.
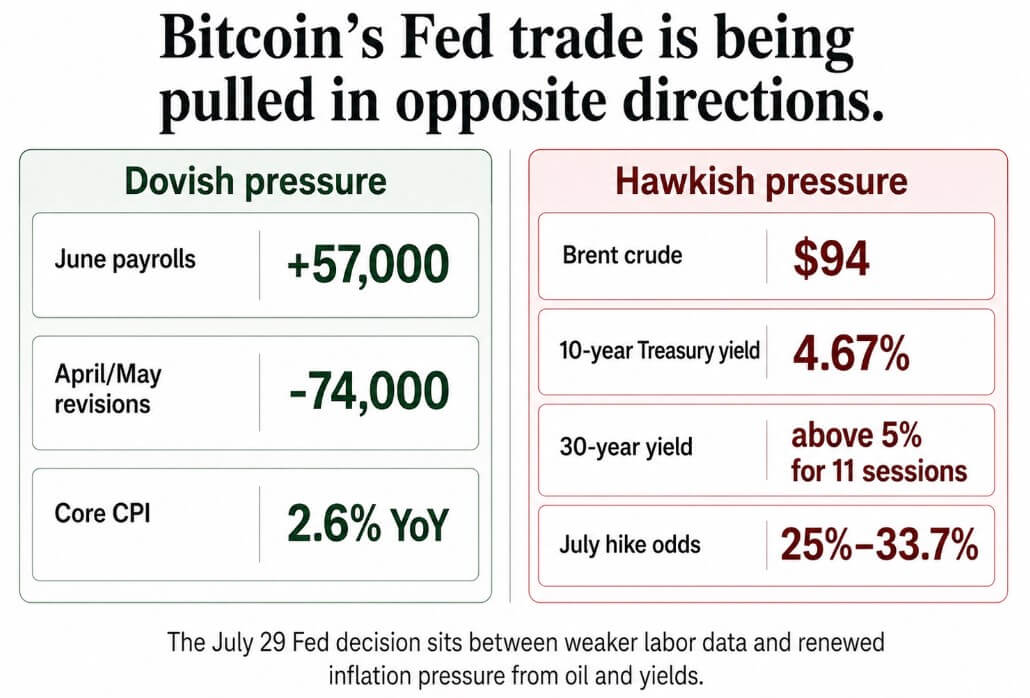
June payrolls rose by only 57,000, unemployment stayed at 4.2%, and revisions cut April and May payrolls by a combined 74,000.
Core CPI held flat month over month and slowed to 2.6% annually, giving traders grounds to expect a less restrictive Fed, with the headline reading, more exposed to energy costs, at 3.5% annually.
Brent crude futures settled around $94 this week, with an intraday high of $95.47. The 10-year Treasury yield climbed to about 4.67%, and the 30-year yield has now spent 11 consecutive sessions above 5%, its longest stretch since May.
Market pricing for a July rate increase has moved into the roughly 25% to 33% range, with one CME-based reading putting the odds at 33.7%, up from 25.7% the previous day.
Glassnode’s on-chain data show Bitcoin has already priced the optimistic outcome for weak labor data and a fresh oil shock converging on the same Fed decision.
Short positions have closed, downside hedging has collapsed, exchange inflows have faded to multi-week lows, and Bitcoin has outperformed equities through the oil shock. Spot Bitcoin ETFs posted six straight positive sessions from July 14 through July 21, adding roughly $930.2 million and reversing a $424.7 million outflow from July 13.
Glassnode’s cohort data show wallets holding between 1,000 and 10,000 BTC, the range typical of funds and large trading desks, drive most of the recent accumulation. Mid-sized holders are distributing again, and Glassnode’s composite market gauge still reads risk-off.
A narrow set of large buyers and fresh ETF demand are carrying a rally resting on a Fed pivot that has yet to happen, keeping the current trade conditional.
If the Fed disappoints, the ETF buyers and the 1,000-10,000 BTC cohort now carrying the rebound absorb the reversal first, since broader participation from smaller holders has not returned.
| Signal | Current reading | What it says | Article implication |
|---|---|---|---|
| BTC spot price | ~$65,978 | Below short-term-holder cost basis | Rebound is not confirmed yet |
| Short-term-holder cost basis | ~$69,000 | Recent buyers still need breakout confirmation | Key test for Fed-pivot trade |
| Demand shelf | ~$63,000 | Around 10% of supply sits nearby | Main downside audit zone |
| ETF flows | +$930.2M over six positive sessions | Institutional bid has returned | Supportive, but not yet proven durable |
| July 13 ETF flow | -$424.7M | Recent outflow shock was reversed | Shows flows can turn quickly |
| Main accumulating cohort | 1,000–10,000 BTC wallets | Large holders driving the rebound | Rally remains narrow |
| Mid-sized holders | Distributing again | Broader participation is missing | Recovery lacks breadth |
| Glassnode market compass | Risk-off | Composite regime has not flipped | Rally remains conditional |
Treasury yields are setting the ceiling
Bond yields add a constraint beneath the $69,000 area, as the 10-year Treasury yield near 4.67% and the 10-year TIPS yield near 2.36% both keep the discount rate on risk assets elevated.
Brent’s three-month timespread widened to about $9.26, the steepest backwardation since May 22, pointing to traders expecting near-term supply to stay tight.
That structure usually accompanies tighter physical markets and feeds into headline inflation expectations, the same input that pushed July hike odds higher this week.
Glassnode’s research frames Bitcoin as a dollar-liquidity asset now, pointing to a deepening inverse relationship with the dollar. The firm set a 10-year yield ceiling near 4.45% and a dollar ceiling near 99 as thresholds for risk assets in its prior report.
The 10-year yield sits at 4.67%, and the dollar index reads about 101.14.
The setup into July 29
In the bull case, the Fed holds rates and frames labor weakness as the dominant risk. Brent cools toward the EIA’s July forecast of $74 for the third quarter, and the 10-year yield retreats below the 4.45% ceiling Glassnode flagged as decisive.
ETF inflows persist, exchange inflows stay low, and accumulation broadens past whale wallets, carrying Bitcoin through $69,000 into the $84,000 zone Glassnode identifies as the next open range.
In the bear case, the Fed holds rates and leaves room for a later hike if oil stays elevated. Brent holds near $94, the 30-year yield stays above 5%, and real yields keep the cost of holding a non-yielding asset high.
ETF inflows fade or reverse, exchange inflows pick back up, and $69,000 rejects. Bitcoin would probably retest the $63,000 shelf, where about 10% of supply sits.
| Scenario | Fed/oil/yield trigger | On-chain confirmation | BTC zone to watch | Meaning |
|---|---|---|---|---|
| Bull case | Fed prioritizes labor weakness; Brent cools toward EIA’s $74 Q3 forecast; 10-year yield falls below 4.45% | ETF inflows persist, exchange inflows stay low, accumulation broadens beyond whales | $69,000 → $84,000 | Bitcoin’s rebound becomes a real liquidity trade |
| Bear case | Fed stays hawkish because oil remains near $94; 30-year yield remains above 5%; real yields stay elevated | ETF inflows fade, exchange inflows rise, whale-led accumulation fails to broaden | $69,000 rejection → $63,000 | Rally looks like a tactical Fed-pivot wager |
| Failure point | Bond market rejects the dovish interpretation | $63,000 shelf breaks or absorbs heavy supply | Below $63,000 | Institutional bid fails its first major stress test |
The EIA’s July outlook expects Brent to average $74 a barrel in the third quarter and $65 in 2027, a full $20 to $30 below the current price.
The IMF’s July update projected 3.0% global growth for 2026, and that projection assumed the Strait of Hormuz reopens by mid-July and normalizes by March 2027, with oil averaging about $89 across the year, an assumption spot Brent has already broken.
The Fed’s July 29 decision will decide whether the ETF buyers and large wallets now carrying Bitcoin’s rebound represent a genuine return of institutional demand or a short-lived bet on a dovish outcome, and a reclaim of $69,000 with broader participation confirms the first read.
Should Bitcoin reject the $69,000 and drop back toward the $63,000 shelf once shorts, hedges, and sellers have already cleared out, the on-chain data will show that the bond market is still pricing in inflation risk and subdued crypto-native demand.
That shelf, holding about 10% of supply, becomes the market’s audit of whether the new institutional bid is durable or just a tactical wager on July 29.