Bitcoin and altcoins saw strong double-digit price rebounds after this week’s brutal sell-off, but do technical charts forecast a longer-term recovery, or is today’s rally just a dead cat bounce?

Bitcoin and altcoins saw strong double-digit price rebounds after this week’s brutal sell-off, but do technical charts forecast a longer-term recovery, or is today’s rally just a dead cat bounce?

Peter Zhang
Feb 04, 2026 09:10
AAVE trades at $128.18 with analysts targeting $137-142 short-term despite oversold conditions. Medium-term Aave forecast eyes $157-162 range as DeFi recovery continues.
Aave (AAVE) finds itself at a critical juncture as the DeFi lending protocol navigates choppy market conditions. Trading at $128.18 with a modest 24-hour decline of 0.09%, AAVE presents both opportunities and risks for traders eyeing the coming weeks.
• Short-term target (1 week): $137-142
• Medium-term forecast (1 month): $157-162 range
• Bullish breakout level: $137.58
• Critical support: $122.88
Recent analyst commentary provides insight into AAVE’s trajectory. According to Caroline Bishop’s February 2nd analysis, “AAVE Price Prediction Summary: Short-term target (1 week): $137-142; Medium-term forecast (2-4 weeks): $157-162 range; Bullish breakout level: $137.58; Critical support: $122.88.”
This Aave forecast aligns with longer-term projections from Peter Zhang, who noted on January 26th that “AAVE shows potential recovery toward analyst targets of $190-195 by February 2026, despite current bearish momentum.”
Earlier analysis from Zach Anderson highlighted the technical tension, observing that “Aave (AAVE) trades at $156.65 with analysts eyeing $190-195 by February 2026, though bearish MACD and oversold conditions suggest near-term caution around $151 support.”
The current technical picture for AAVE reveals a token under pressure but potentially oversold. With an RSI of 33.88, AAVE sits in neutral territory, though closer to oversold conditions than overbought levels.
The MACD histogram reading of -0.0000 confirms bearish momentum remains intact, while the token trades significantly below key moving averages. AAVE currently sits below its 7-day SMA of $131.49, 20-day SMA of $150.36, and well beneath its 200-day SMA of $230.13.
Bollinger Band analysis shows AAVE positioned at 0.15, indicating the token trades much closer to the lower band ($118.68) than the upper band ($182.03). This positioning often suggests oversold conditions and potential for mean reversion.
Key resistance levels emerge at $132.52 (immediate) and $136.85 (strong), while support levels sit at $122.37 (immediate) and $116.55 (strong). The Average True Range of $9.72 indicates moderate volatility conditions.
In the optimistic case, AAVE could target the analyst-predicted $137-142 range within the next week. This would require breaking through immediate resistance at $132.52 and the critical $136.85 level. A sustained move above $137.58 could trigger additional buying pressure toward the $157-162 medium-term target range.
For this AAVE price prediction to materialize, traders should watch for RSI recovery above 40 and positive MACD divergence. Volume confirmation above the recent $17.88 million daily average would provide additional bullish validation.
The downside case sees AAVE testing critical support at $122.88. A break below this level could accelerate selling toward the strong support zone at $116.55, representing potential downside of approximately 9% from current levels.
Risk factors include continued DeFi sector weakness, broader crypto market correction, and failure to hold above the lower Bollinger Band. The current position below all major moving averages suggests the path of least resistance remains downward.
For traders considering AAVE exposure, a layered approach appears prudent. Initial positions could be established around current levels ($128), with additional accumulation planned near the $122.88 support zone.
Stop-loss orders below $116.55 would limit downside exposure while allowing room for normal volatility. Target scaling begins around $137-142 for short-term traders, with longer-term holders eyeing the $157-162 range.
Given the current technical setup, risk management remains paramount. Position sizing should account for AAVE’s $9.72 daily trading range and the potential for increased volatility during breakout attempts.
This AAVE price prediction suggests cautious optimism despite current technical headwinds. The analyst consensus around $137-142 short-term targets appears reasonable given oversold conditions, though the bearish momentum backdrop requires careful risk management.
The medium-term Aave forecast toward $157-162 depends heavily on broader DeFi sector recovery and successful defense of key support levels. While the long-term $190-195 targets remain possible, near-term focus should center on the immediate $137.58 breakout level.
Disclaimer: This AAVE price prediction is for informational purposes only and should not be considered financial advice. Cryptocurrency investments carry significant risks, and past performance does not guarantee future results. Always conduct your own research and consider your risk tolerance before making investment decisions.
Image source: Shutterstock
Ted Hisokawa
Feb 01, 2026 17:23
AAVE trades at $123.66 with RSI at 28.39 showing oversold conditions. Technical analysis suggests potential recovery to $140-160 range by March 2026 if key resistance levels break.
• Short-term target (1 week): $130-138
• Medium-term forecast (1 month): $140-160 range
• Bullish breakout level: $138.01
• Critical support: $108.49
While specific analyst predictions are limited in recent market commentary, on-chain metrics suggest AAVE is experiencing significant technical pressure. According to current market data, the token has declined 47% from its 200-day moving average of $233.05, indicating a prolonged downtrend that may be reaching exhaustion levels.
The lack of recent institutional coverage doesn’t necessarily indicate bearish sentiment, but rather suggests market participants are waiting for clearer technical signals before making bold predictions about Aave’s trajectory.
AAVE’s current technical setup presents a compelling oversold scenario that could lead to a meaningful bounce. Trading at $123.66, the token sits well below all major moving averages, with the RSI at 28.39 firmly in oversold territory below the 30 threshold.
The MACD histogram at 0.0000 shows bearish momentum has stalled, while the MACD line at -8.4655 matches the signal line, suggesting potential for momentum divergence. This technical alignment often precedes trend reversals in cryptocurrency markets.
Bollinger Bands analysis reveals AAVE trading at -0.0738 relative to the bands, meaning it’s trading below the lower band at $128.03. This extreme positioning historically indicates oversold conditions and potential mean reversion toward the middle band at $157.63.
The 24-hour trading range of $115.66 to $130.42 shows significant volatility, with the Average True Range (ATR) at $10.47 confirming elevated price swings that could benefit short-term traders.
The primary upside target for this AAVE price prediction centers on the immediate resistance at $130.83, which aligns closely with the Bollinger Band lower boundary. A break above this level could trigger short covering and momentum buying toward the strong resistance at $138.01.
If AAVE sustains above $138, the next logical target becomes the 7-day SMA at $144.49, followed by the EMA 12 at $146.40. The ultimate bull case targets the 20-day SMA at $157.63, representing a 27% gain from current levels.
Technical confirmation would require RSI breaking above 40 and MACD histogram turning positive, indicating genuine momentum shift rather than a dead cat bounce.
The downside risk remains significant if AAVE fails to hold current support levels. The immediate support at $116.07 represents the first critical test, with a break potentially leading to the strong support at $108.49.
Below $108, AAVE could face accelerated selling toward psychological support at $100, representing additional 19% downside. The bearish case would be confirmed by RSI failing to break above 35 and continued MACD divergence.
Risk factors include broader DeFi sector weakness, regulatory concerns around lending protocols, and potential liquidations if institutional holders reduce exposure.
Based on current technical conditions, a layered entry strategy appears optimal for this Aave forecast. Consider initial positions near current levels around $123-125, with additional accumulation on any dips toward $116-118.
For risk management, implement stop-losses below $108 to limit downside exposure. The risk-reward ratio favors long positions given the oversold conditions and proximity to technical support levels.
Conservative traders should wait for RSI to break above 35 and price to reclaim $130 before establishing positions. More aggressive traders can capitalize on the current oversold bounce potential with tight risk management.
Position sizing should reflect the high volatility environment, with ATR at $10.47 suggesting daily moves of 8-9% are common.
This AAVE price prediction suggests a high probability of recovery from current oversold levels, with targets of $140-160 by March 2026 representing realistic upside potential. The combination of extreme RSI readings, Bollinger Band positioning, and stalled bearish momentum creates favorable conditions for a technical bounce.
However, sustained recovery above $138 resistance remains crucial for confirming trend reversal. The 70% confidence level reflects strong technical setup offset by broader market uncertainties.
Disclaimer: Cryptocurrency price predictions involve significant risk and should not constitute sole investment advice. AAVE and all digital assets remain highly volatile and speculative investments.
Image source: Shutterstock

Traders are watching $0.127 as near-term support, with $0.137 now the key level DOGE must reclaim to stabilize.
 Jumps 8%")
The Bitcoin price surged through the $96,000 level this afternoon, pushing decisively above a key resistance zone and signaling a renewed wave of bullish momentum after weeks of choppy, range-bound trading.
At the time of writing, the bitcoin price is trading around $96,000 up roughly 4.4% over the past 24 hours, according to market data.
The breakout marks a clear move beyond the upper boundary of January’s consolidation range. Bitcoin price is now hovering near its weekly highs, sitting approximately 5% above its seven-day low near $91,700, as buyers regain control of short-term market structure.
All this is happening as the US Senate Agriculture Committee has delayed its key markup of the Digital Asset Market Structure CLARITY Act until late January. The Senate’s Banking Committee markup is still scheduled for January 15.
Senate Agriculture Committee Chairman John Boozman announced a timeline for advancing crypto market structure legislation, with legislative text set for release by the close of business on Wednesday, January 21, and a committee markup scheduled for Tuesday, January 27, at 3 p.m.
Boozman said the schedule is designed to ensure transparency and thorough review while providing regulatory clarity for crypto markets and supporting consumer protection and U.S. innovation.
The delay signals that Senate leaders may lack the votes to advance the bill amid disagreements over stablecoin rewards, DeFi oversight, and SEC–CFTC authority.
Although the House passed its version in mid-2025, the bill cannot move forward unless both Senate committees approve it.
Despite this, Bitcoin trading activity is rallying alongside the price rally, with 24-hour volume climbing to roughly $55 billion, reflecting renewed participation as price accelerated higher.
Bitcoin’s total market capitalization has risen to approximately $1.92 trillion, reinforcing its dominance within the digital asset market. Circulating supply currently stands at just under 19.98 million BTC, inching closer to the protocol’s fixed 21 million coin cap.
Shares of Strategy (MSTR) jumped sharply today as well, closing at $172.99 USD with a 6.63% gain today and extending strength in after-hours trading up to $177.00, up +2 after hours, as investors continue to price in the company’s high-risk, bitcoin-linked strategy.
On January 12, Strategy announced they added 13,627 bitcoin for $1.25 billion, lifting its total holdings to 687,410 BTC.
The purchases were made between January 5 and January 11 and funded through the company’s at-the-market offering program, which included sales of Class A common stock (MSTR) and its 10.00% Series A perpetual preferred stock, Stretch (STRC).
Tuesday’s surge follows several failed breakout attempts over the last couple of months, when bitcoin repeatedly tested resistance near the mid-$94,000 range before pulling back.
For much of the past month, price action remained compressed between roughly $85,000 and $94,000, prompting analysts to warn that bulls needed a decisive move higher to reassert control. That move now appears to be underway.
If the bitcoin price can sustain acceptance above $96,000, the next major resistance zones sit between $98,000 and $104,000, levels that previously capped upside momentum. A failure to hold current levels, however, could see price retrace toward former resistance turned potential support.
The breakout arrives as investors continue to weigh inflation trends, interest-rate expectations, and escalating political uncertainty tied to U.S. monetary policy.
On the political side, the Department of Justice has opened a criminal investigation into Federal Reserve Chair Jerome Powell. The investigation is intensifying a months‑long feud between the White House and the U.S. central bank
According to Powell, the DOJ served the Federal Reserve with grand jury subpoenas and threatened a criminal indictment tied to his June 2025 testimony about a $2.5 billion plus renovation of Fed office buildings.
In recent months, the bitcoin price has increasingly traded in response to macro narratives, with many participants viewing it as a hedge against policy instability and long-term currency debasement.
At the time of publication, the bitcoin price is near $96,000.
Felix Pinkston
Jan 12, 2026 10:17
AAVE price prediction shows potential upside to $190 by month-end despite current $164.45 trading level, with technical analysis revealing mixed signals and analyst targets up to $195.
Aave (AAVE) is currently trading at $164.45, down 1.21% in the past 24 hours, as the DeFi lending protocol navigates mixed technical signals. Despite the recent decline, analyst predictions suggest significant upside potential for the remainder of January 2026.
• Short-term target (1 week): $175-$180
• Medium-term forecast (1 month): $185-$195 range
• Bullish breakout level: $174.38
• Critical support: $159.08
Recent analyst coverage presents an optimistic AAVE price prediction outlook for the coming weeks. Rebeca Moen provided bullish commentary on January 3, 2026, stating that “AAVE price prediction shows bullish reversal potential with targets at $185-195 over next 3-4 weeks, supported by oversold RSI recovery and positive MACD momentum.”
Building on this sentiment, Luisa Crawford offered an updated Aave forecast on January 6, 2026, noting that “AAVE price prediction points to $190 upside target by month-end as bullish MACD histogram and RSI recovery from oversold levels signal potential breakout from current $174 level.”
These analyst projections align with technical patterns suggesting AAVE could see substantial gains if it can break above key resistance levels.
The current technical picture for AAVE presents a mixed but potentially constructive setup. The RSI reading of 48.24 places AAVE in neutral territory, indicating neither overbought nor oversold conditions. This neutral positioning could provide room for upward movement without immediate technical constraints.
However, the MACD histogram reading of -0.0000 suggests bearish momentum remains present, though the minimal negative value indicates this bearish pressure may be weakening. The MACD line at -1.5169 matches the signal line, suggesting a potential momentum shift could be approaching.
AAVE’s position within the Bollinger Bands shows promise, with the current price at 64% of the distance between the lower and upper bands. This positioning above the middle band (SMA 20 at $159.59) indicates bullish bias, while still providing room to move toward the upper band at $177.01.
The key resistance level sits at $174.38, representing a critical breakout point for bulls. Immediate resistance at $169.41 must first be cleared. On the downside, immediate support at $161.76 should hold, with stronger support at $159.08 aligning closely with the 20-period SMA.
In the bullish case, AAVE price prediction models suggest targets between $185-$195 are achievable by month-end. The path higher would likely begin with a break above the immediate resistance at $169.41, followed by a decisive move through the strong resistance at $174.38.
Technical confirmation for the bullish scenario would require the RSI to move above 60, indicating strengthening momentum, and the MACD histogram to turn positive. A close above the upper Bollinger Band at $177.01 would signal strong bullish momentum and open the door to the analyst targets.
The 24-hour trading volume of $9.27 million provides adequate liquidity for such moves, though increased volume would be needed to sustain breakout momentum.
The bearish case for this Aave forecast would see AAVE failing to hold current support levels. A break below the immediate support at $161.76 could trigger further selling toward the strong support at $159.08.
A decisive break below the 20-period SMA at $159.59 would shift the short-term bias negative and could target the lower Bollinger Band at $142.17. The current MACD reading already shows bearish momentum, and further deterioration could accelerate downside moves.
Risk factors include broader crypto market weakness, DeFi sector rotation, and failure to maintain key technical levels.
For investors considering AAVE positions, the current technical setup offers several entry opportunities. Conservative buyers might wait for a pullback to the $161.76 support level, providing a better risk-reward ratio for targeting the $185-$195 analyst projections.
More aggressive traders could enter on a confirmed break above $169.41 with a stop-loss below $159.08. This strategy aligns with the bullish AAVE price prediction while managing downside risk.
Position sizing should account for the daily Average True Range of $8.33, indicating significant intraday volatility. Risk management remains crucial given the mixed technical signals.
The AAVE price prediction for January 2026 remains constructive despite current neutral momentum. Analyst targets of $185-$195 appear achievable if AAVE can break through key resistance levels and confirm the bullish reversal patterns identified in recent technical analysis.
While the current $164.45 price level presents mixed signals, the combination of neutral RSI positioning, potential MACD momentum shift, and favorable Bollinger Band placement supports a cautiously optimistic Aave forecast. Traders should monitor the key $174.38 resistance level for confirmation of the bullish scenario.
Disclaimer: This AAVE price prediction is for educational purposes only and should not be considered financial advice. Cryptocurrency investments carry significant risk, and past performance does not guarantee future results.
Image source: Shutterstock
Joerg Hiller
Jan 11, 2026 14:41
Recent analyst forecasts suggest AAVE could rally 18-25% from current levels, with technical indicators showing mixed signals as the token trades at $167.02. AAVE Price Prediction Summary • Short-…
Recent analyst forecasts suggest AAVE could rally 18-25% from current levels, with technical indicators showing mixed signals as the token trades at $167.02.
• Short-term target (1 week): $185-196
• Medium-term forecast (1 month): $186-214 range
• Bullish breakout level: $169.61
• Critical support: $162.57
While specific analyst predictions from major crypto influencers are limited in recent hours, several research firms have published bullish AAVE price predictions for January 2026. According to recent analysis from blockchain.news, Rebeca Moen highlighted on January 3rd that “AAVE price prediction shows bullish reversal potential with targets at $185-195 over next 3-4 weeks, supported by oversold RSI recovery and positive MACD momentum.”
CoinCodex’s technical models suggest even higher upside potential, forecasting that “Over the next five days, Aave will reach the highest price of $196.08 on Jan 13, 2026, which would represent 18.68% growth compared to the current price.” This aggressive Aave forecast aligns with similar projections from Changelly, which estimates January targets between $186.71 and $213.53.
The consensus among these analysts points to significant upside potential, with most AAVE price predictions clustering around the $185-200 range for the immediate term.
Current technical indicators present a mixed but cautiously optimistic picture for AAVE. The token is trading at $167.02, sitting above its 20-day SMA of $158.86 but below the 7-day SMA of $168.14, suggesting short-term consolidation.
The RSI reading of 50.31 places AAVE in neutral territory, indicating neither overbought nor oversold conditions. This provides room for movement in either direction without immediate technical constraints. However, the MACD histogram at 0.0000 suggests bearish momentum has stalled, potentially setting up for a reversal.
Bollinger Band analysis reveals AAVE is positioned at 0.73 within the bands, closer to the upper band at $176.45 than the lower band at $141.28. This positioning suggests upward pressure, though traders should watch for potential resistance near the upper band.
The Average True Range (ATR) of $8.28 indicates moderate volatility, providing sufficient price movement for tactical trading opportunities while maintaining relative stability.
In the bullish case, AAVE faces immediate resistance at $168.32, followed by strong resistance at $169.61. A clean break above $169.61 would likely trigger momentum toward the $185-196 targets identified by analysts. The upper Bollinger Band at $176.45 represents an intermediate target that could provide temporary resistance.
For the bullish scenario to materialize, AAVE would need to maintain support above the current pivot point of $166.09 and demonstrate sustained buying volume. The neutral RSI provides ample room for upward movement without hitting overbought conditions.
Should selling pressure intensify, AAVE’s immediate support sits at $164.80, with stronger support at $162.57. A breakdown below $162.57 could expose the lower Bollinger Band around $141.28, representing a significant 15% decline from current levels.
The bearish case would be confirmed by a breakdown below the 20-day SMA at $158.86, particularly if accompanied by increasing volume and deteriorating momentum indicators.
Based on current technical levels, conservative buyers might consider entering near the immediate support at $164.80, with a stop-loss below the strong support at $162.57. More aggressive traders could enter at current levels around $167, using the pivot point of $166.09 as their stop-loss reference.
For those seeking confirmation, waiting for a breakout above $169.61 with volume could provide a higher probability entry, albeit at a higher price point. This approach would target the analyst-projected levels of $185-196 while managing downside risk.
Risk management remains crucial given AAVE’s volatility profile. Position sizing should account for the $8.28 daily ATR, and traders should be prepared for intraday swings of 5-7% in either direction.
The AAVE price prediction consensus points to significant upside potential over the next 2-4 weeks, with targets ranging from $185 to $196 representing 11-18% gains from current levels. Technical indicators support this Aave forecast, showing neutral RSI conditions and potential for momentum reversal.
However, immediate resistance at $169.61 must be cleared for the bullish thesis to materialize. Current support levels provide reasonable risk management parameters for position entry around $164-167.
Disclaimer: Cryptocurrency price predictions are speculative and subject to high volatility. This analysis is for informational purposes only and should not be considered financial advice. Always conduct your own research and consider your risk tolerance before making investment decisions.
Image source: Shutterstock

Start every day with the top news stories right now, plus original features, a podcast, videos and more.

Ethereum price is approaching a critical technical moment as it trades near the upper boundary of a descending wedge. ETH’s slow but steady climb has placed it inches from a breakout.
This momentum is widely attributed to the Fusaka upgrade, which went live on December 3 and aims to improve scalability while lowering Layer 2 costs, a long-standing Ethereum challenge.
Sponsored
Sponsored
These changes arrive as market participants position for 2026, creating favorable conditions for network growth and price stabilization.
Ethereum network activity has expanded quickly over the past three weeks. Data shows a sharp rise in new addresses, defined as wallets interacting with ETH for the first time. This metric has increased by roughly 110% during the period, highlighting accelerating user adoption.
Ethereum now adds approximately 292,000 new addresses per day. This surge reflects a combination of seasonal factors and structural upgrades.
Christmas 2025, New Year positioning, and optimism surrounding the Fusaka upgrade appear to be driving renewed engagement across the ecosystem.
Want more token insights like this? Sign up for Editor Harsh Notariya’s Daily Crypto Newsletter here.
Rising address creation often precedes increased transaction demand. While not every new address represents a long-term investor, sustained growth at this scale suggests expanding participation. Broader user inflows typically improve liquidity depth and reinforce price resilience during volatile market phases.
Sponsored
Sponsored
Macro indicators present a mixed but informative picture. HODL Waves show growth among mid-term holders, defined as wallets holding ETH for three to six months. These investors largely entered positions between July and October 2025.
Early July buyers currently sit in profit, while those who entered after mid-July remain underwater. This distribution creates forced holding behavior, as many holders wait for price recovery. Such positioning can provide temporary support by reducing selling pressure during pullbacks.
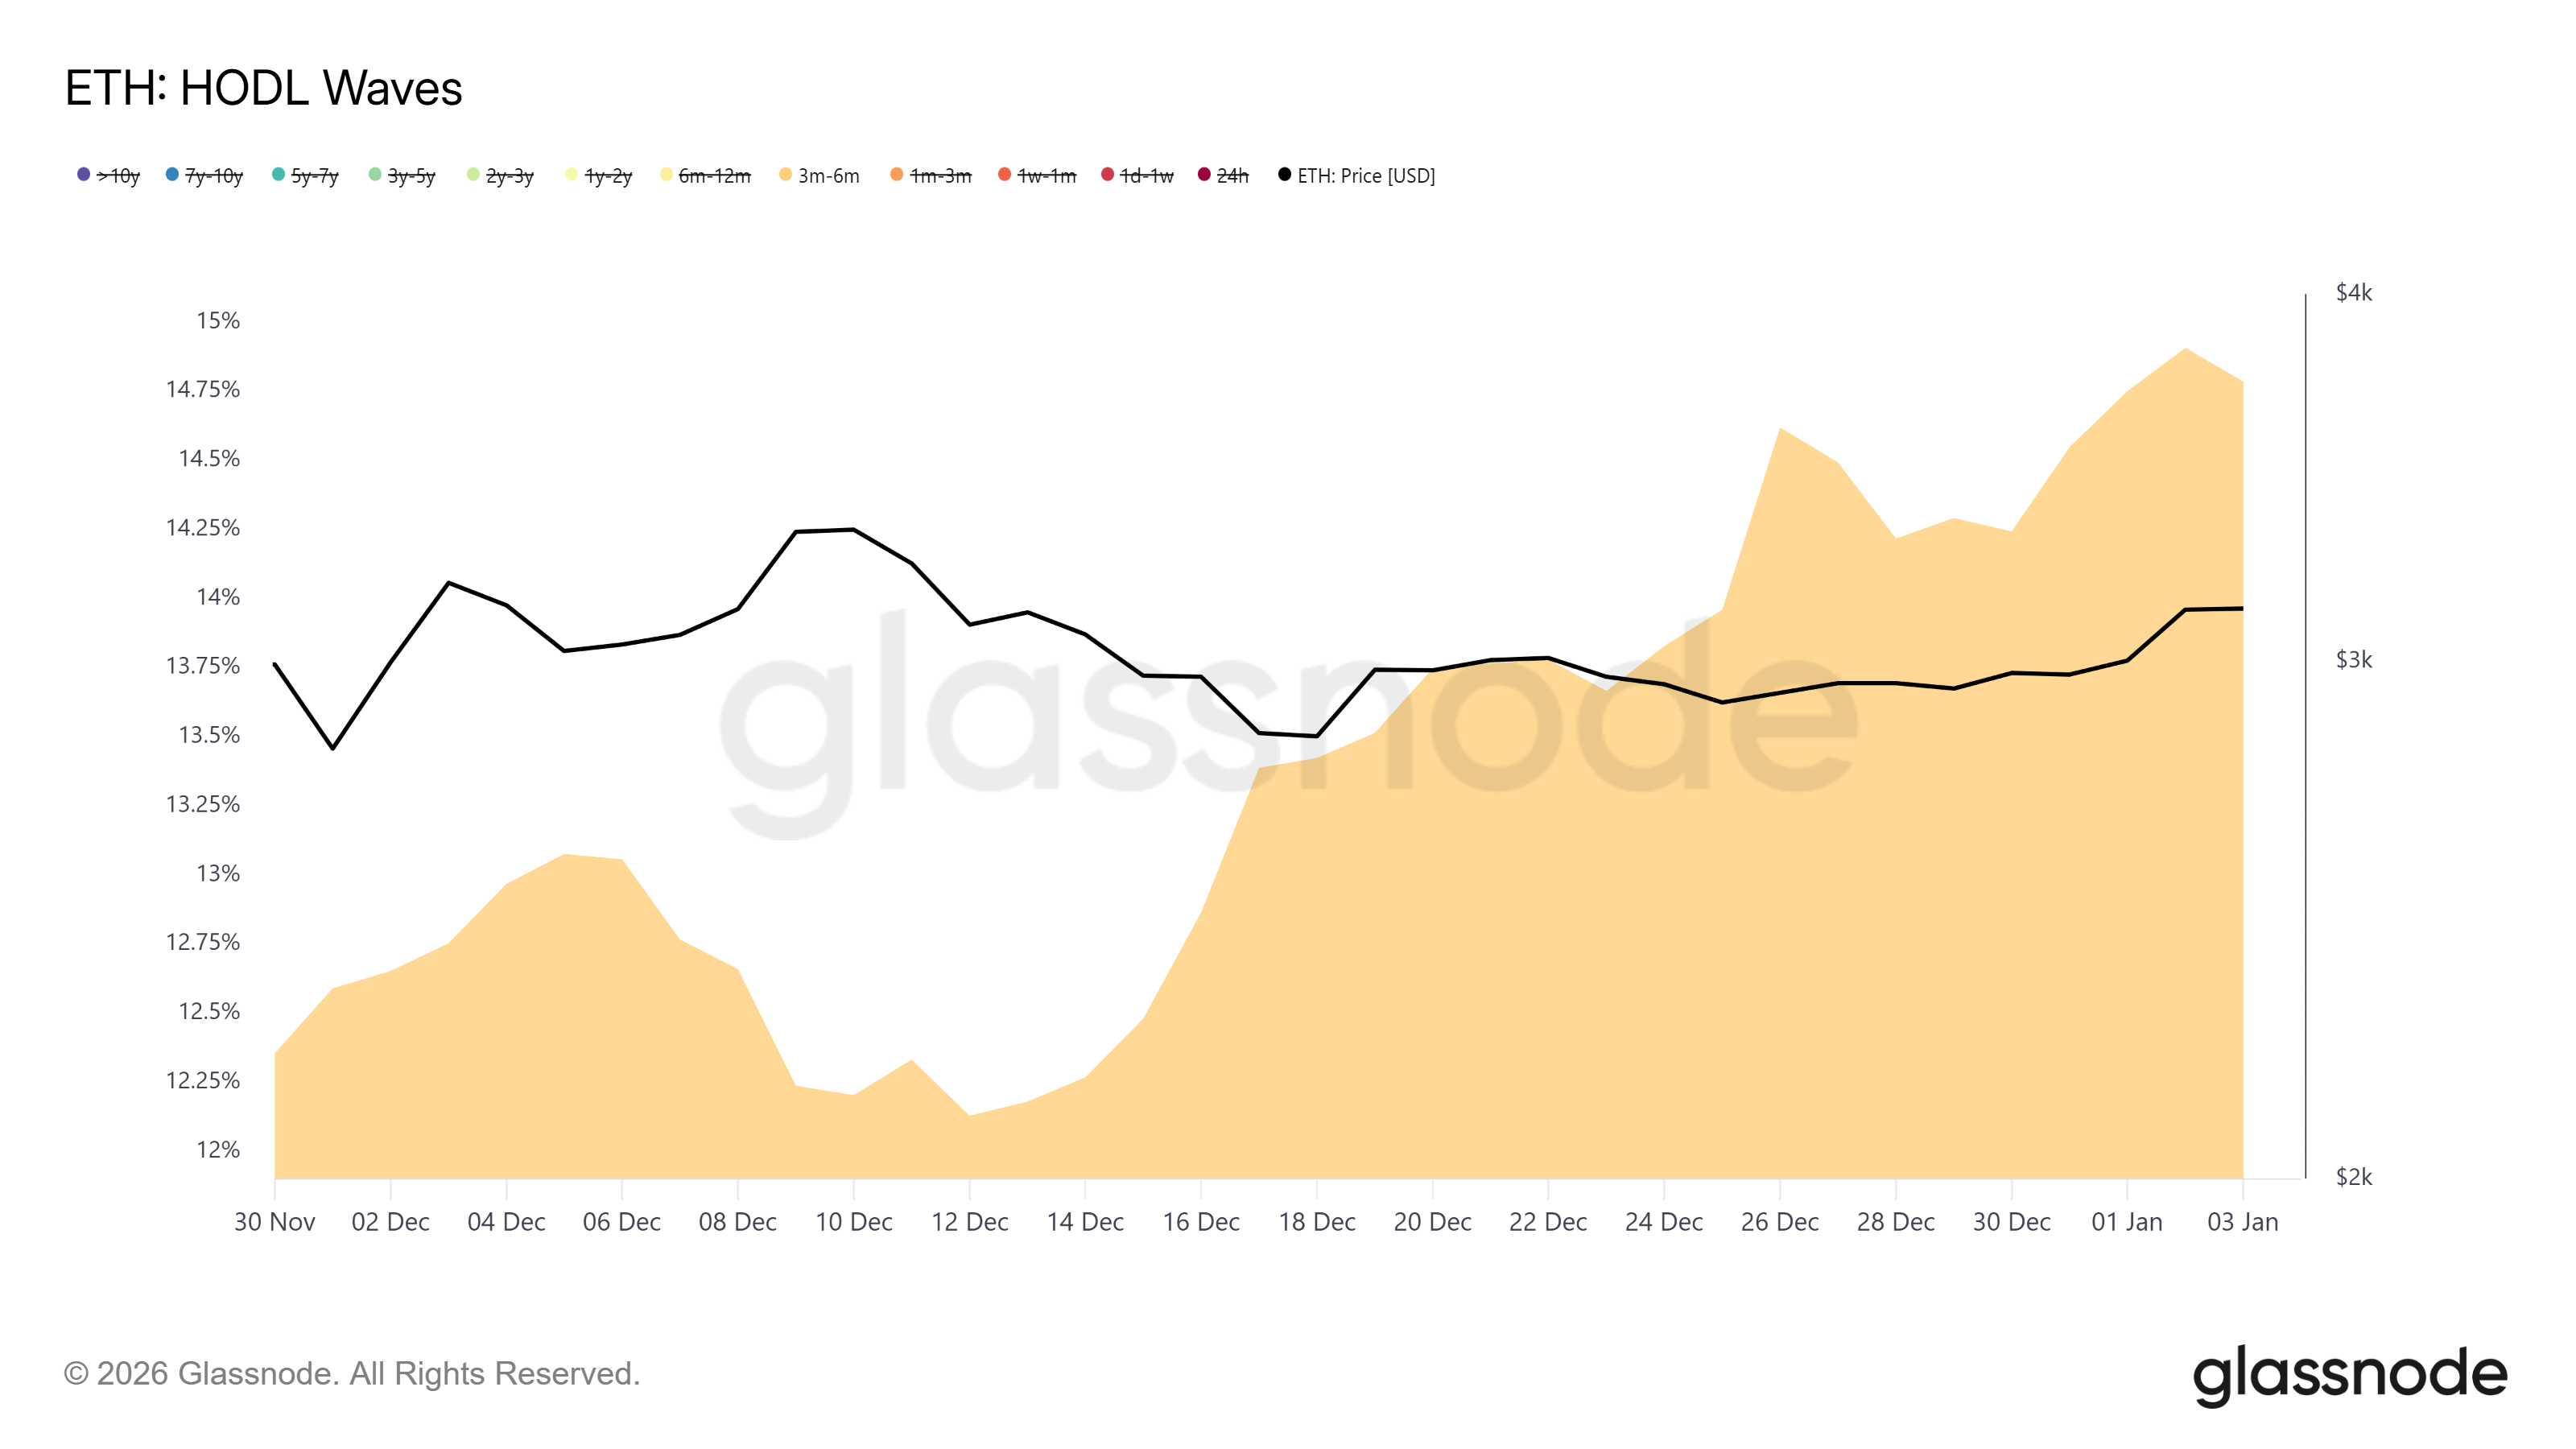
However, rising prices may trigger distribution from these cohorts. As ETH approaches break-even levels for mid-term holders, selling risk increases. This dynamic could limit upside unless fresh capital offsets profit-taking from trapped supply.
Ethereum price continues to trade within a descending wedge that formed in early November. ETH currently changes hands near $3,141, placing it close to a potential breakout. The structure suggests momentum is compressing, often preceding directional expansion.
The wedge projects a theoretical upside of roughly 29.5%, targeting $4,061. While ambitious, such a move would require stronger buying pressure than currently observed. A more realistic scenario involves ETH breaking out and pushing past $3,287, opening a short-term path toward $3,447.
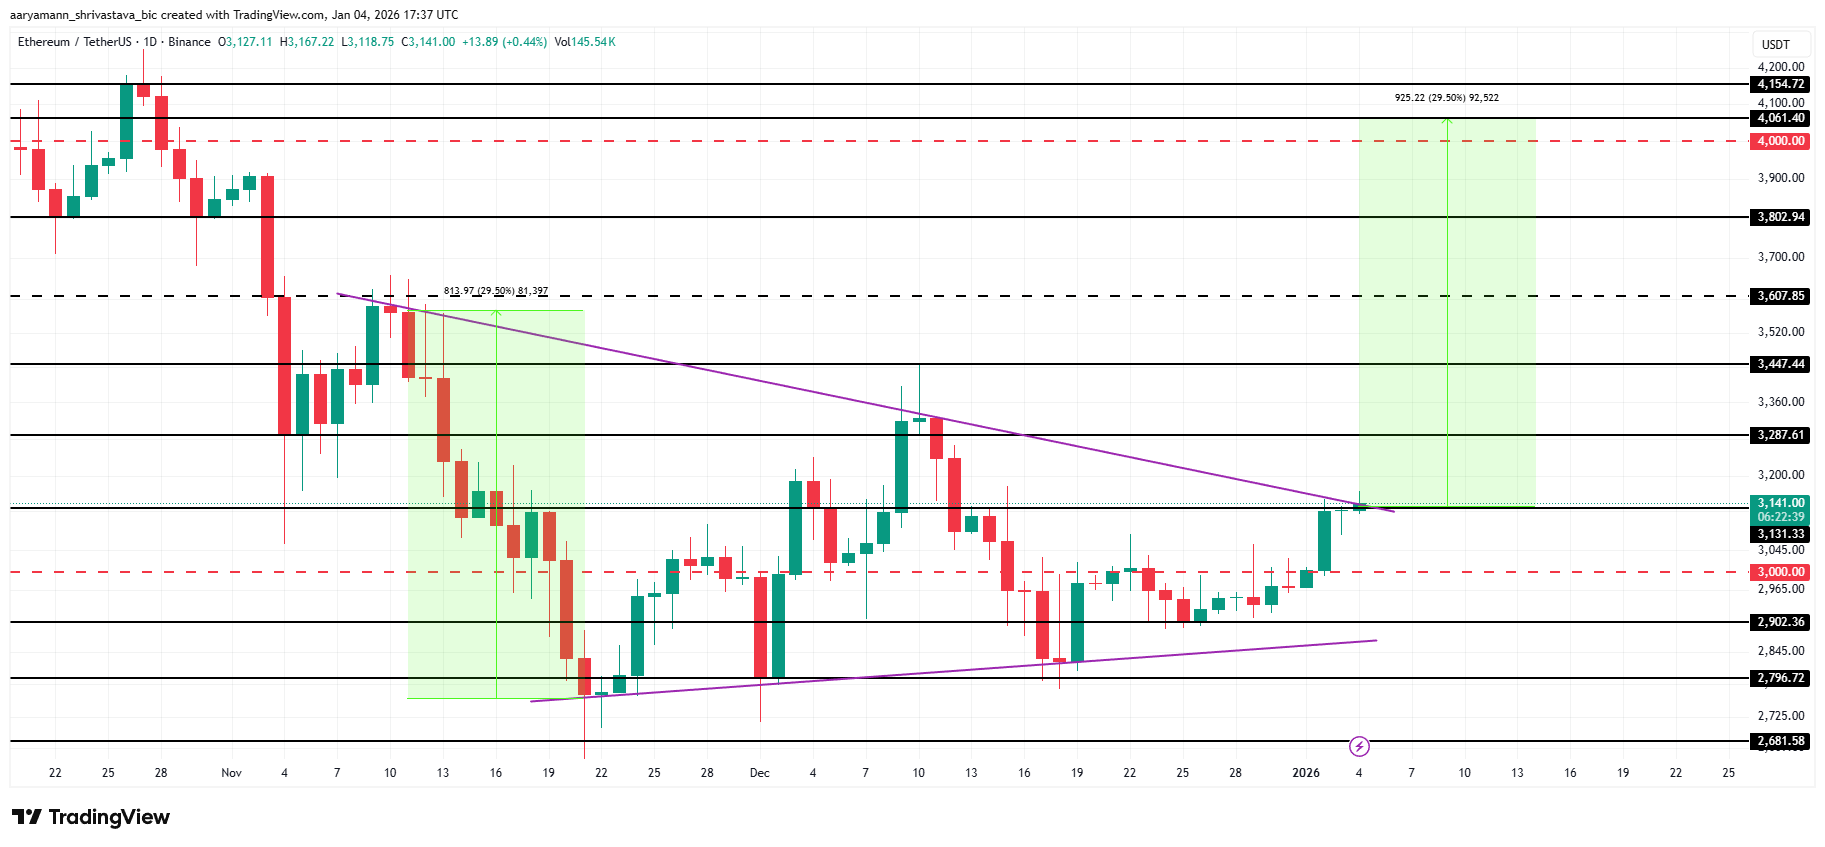
Downside risks remain if macro conditions deteriorate or the breakout fails. A rejection could send Ethereum back below $3,000. In that case, ETH may retest the $2,902 support level, invalidating the bullish thesis and reinforcing range-bound conditions.

DOGE is the top performer from the larger-cap alts today.
Bitcoin’s price rally that started on Friday morning drove it to a multi-week peak of $91,000, where the asset was rejected and driven south, especially since the latest geopolitical development between the US and Venezuela.
Many altcoins have performed a lot better on a daily scale, including some of the meme coin reps, such as DOGE and PEPE.
After being one of the few global assets to end 2025 in the red, bitcoin’s price finally started to show some revival signs on January 2. Following a quiet January 1, in which it remained sideways between $87,000 and $88,000, the cryptocurrency went on the offensive yesterday and broke past $90,000 for the first time in about a week.
This time, the bulls kept the pressure on and drove it even further north to a multi-week peak of $91,000. However, that was as far as BTC would go, at least for now, and it quickly retraced to $90,000. It added several hundred dollars late on Friday, but the explosions in Venezuela’s capital on Saturday morning halted its progress.
Bitcoin dipped to $89,300 but now sits closer to $90,000 after US President Donald Trump confirmed that his country’s military was behind the strikes against Caracas. Moreover, he added that the US captured Venezuela’s President Nicolás Maduro and his wife, who were flown out of the country.
A press conference is expected later today, which could result in more volatility in the crypto market, given that it’s the only financial market open today. For now, BTC’s market cap has neared $1.8 trillion, while its dominance over the alts is below 57% on CG.
Ethereum has reaffirmed its place well above $3,000 and even trades close to $3,100 now. XRP surpassed BNB in terms of market cap after a 6% surge to $2.00. ADA and BCH have increased by similar percentages today.
Dogecoin has rocketed by over 10% and trades north of $0.14. PEPE is the other notable meme coin gainer, having surged by another 15% to $0.000006. Nevertheless, MYX has stolen the show with an 85% pump today to almost $7.
The total crypto market cap has added around $80 billion since January 1 and now sits at $3.145 trillion on CG.
Disclaimer: Information found on CryptoPotato is those of writers quoted. It does not represent the opinions of CryptoPotato on whether to buy, sell, or hold any investments. You are advised to conduct your own research before making any investment decisions. Use provided information at your own risk. See Disclaimer for more information.