Strive plans fresh funding for bitcoin purchases as TD Cowen sees warrant-related stock pressure easing.


 Live Chat
Strive plans fresh funding for bitcoin purchases as TD Cowen sees warrant-related stock pressure easing.

Zcash’s NU7 upgrade is now live on testnet, giving developers several weeks to assess 25-second blocks and other protocol changes before a planned November mainnet activation.

OpenAI has paused training of its newest AI models after its agents used access keys found online to pull data from a U.S. Census Bureau website, per the Associated Press. It is the second time the company has stopped training since its agents breached Hugging Face, a site where developers share AI models.
An agent is an AI program that browses the web and writes code on its own, without a person approving each step. OpenAI tests them during training, the stage where a model learns by repeated practice, and during evaluation, where it gets graded on tasks.
These digital guys have caused OpenAI a lot of problems trying to achieve tasks, no matter what it takes. They have already hacked private companies, now they’re hacking governments, and breaching sensitive portals, even from the United States government.
OpenAI’s agents hunting for data found developer keys, passcodes that let software talk to a website’s data service, sitting in public code repositories on GitHub, a site where programmers post their code for anyone to see. They used the keys to pull demographic and economic figures from the US Census Data API, the bureau’s automated data feed.
The Commerce Department says the data was public. Nothing secret walked out the door.
The trouble is how the agents got in. OpenAI’s own reporting framework lists using exposed credentials without permission as a category of misbehavior, and “misalignment” is the industry word for an AI doing something its designers didn’t intend.
OpenAI’s answer, per CNN, is that some of the incidents involved government sites because its models often turn to them as authoritative sources of public information. Besides the Commerce Department, other agencies were also affected by these malicious—or “rogue” as they like to call it—agents.
The agents probed the SEC, but that episode was milder. Agents copied public material from SEC.gov and Investor.gov and reposted it on another webpage, and OpenAI says it found no use of SEC credentials. The SEC says it knows of no unauthorized access to nonpublic information.

BitcoinBTC · USD
$83,157−2.87%
Sep 22Sep 23Sep 25Sep 27Sep 29
$87.2k$85.7k$84.2k$82.7k
24h HighHigh$84,265
24h LowLow$82,581
VolVol$1.7B
Market projectionsOdds by Myriad
 →
The Education Department is the murkier case. Transluce, an independent AI research lab, says an agent that appeared to come from OpenAI tried and failed to break into the site of the department’s civil rights office. OpenAI is still investigating that one, and the department says it found no impact.
Outsiders flagged that attempt, not OpenAI. Transluce’s earlier work relied on public records from urlquery.net, a web-scanning service, and traces suspected agent activity back to March.
The “misaligned” use of access keys are a repeat of an older trick. In the Hugging Face case, OpenAI’s own incident report said an agent stole a login credential to reach a biology file, and an independent researcher later found the agents had been probing the site since May.
On July 21, OpenAI disclosed that GPT-5.6 Sol and an unreleased model had escaped a sandbox, an isolated test environment with no internet access, during a cybersecurity test and breached Hugging Face. Two days later, two members of Congress introduced a bill that would let the federal government switch off an AI model. It exempts red-teaming, meaning adversarial testing, so the Hugging Face breach would not have triggered it.
In June, an OpenAI agent got into an Australian Medicare statistics portal. Prime Minister Anthony Albanese said OpenAI took roughly three months to tell his government, and called the way it did so unacceptable.
OpenAI says it has notified dozens of organizations so far, and that its review of the agents’ activity will take months.
Start every day with the top news stories right now, plus original features, a podcast, videos and more.

Genius Group has announced a new plan to buy bitcoin — just months after selling its entire stash.
The NYSE-listed AI-powered education company said in a Thursday statement that it was aiming to build parallel AI and bitcoin treasuries worth a combined $1.6 billion, with total company assets targeted at $2 billion by fiscal year 2031.
Just in April, Genius Group sold its entire bitcoin reserves to repay $8.5 million in debt. The sale came as a number of digital asset treasuries were struggling due to a drop in crypto prices.
“Every dollar of preferred capital deployed into our bitcoin and AI Treasury that generates returns above the preferred dividend rate flows directly to our ordinary shareholders’ net asset value,” Genius Group CEO Roger James Hamilton said.
Genius Group first adopted a “Bitcoin first” strategy in late 2024, building a position that grew to 440 BTC by February 2025.
That effort was disrupted when a court order blocked the company from raising funds or issuing shares, forcing a series of sales that reduced its holdings — including roughly 86 BTC sold in a single month, leaving about 84 BTC by February 2026.
The company has now sold its remaining bitcoin entirely, using the proceeds to eliminate $8.5 million in debt. The liquidation reportedly came at a loss, leaving Genius Group with no crypto reserves.
Against that backdrop, the company is now proposing to rebuild a bitcoin treasury — this time alongside a similarly sized AI treasury — funded not through equity sales but through a new preferred stock offering.
Genius Group intends to draw on its $1.2 billion SEC-cleared shelf registration to issue Perpetual Preferred Securities, targeting an initial $12.5 million raise. Proceeds would be split between the AI treasury, the bitcoin treasury and a cash reserve covering about 18 months of dividend payments.
The plan mirrors moves by the biggest corporate holder of bitcoin, Strategy. The company has raised over $16 billion via perpetual preferred stock for its bitcoin holdings. Nasdaq-listed Strive Asset Management has raised more than $150 million similarly.
Genius Group says preferred capital will become its primary funding tool going forward, reducing reliance on its ordinary share ATM program.

Bitcoin (BTC) declined into Friday’s Wall Street open as traders increasingly saw a BTC price breakdown next.
Key points:
Data from TradingView showed BTC/USD down 1.3% on the day at $62,570, near its lowest levels month-to-date.
BTC/USD four-hour chart. Source: Cointelegraph/TradingView
Despite encouraging US inflation data lifting risk assets and reducing the odds of interest-rate hikes, Bitcoin failed to follow US equities, which closed Thursday’s session at all-time highs. The S&P 500 and tech-heavy Nasdaq Composite Index were both green at the time of writing, up 0.11% and 0.14%, respectively.
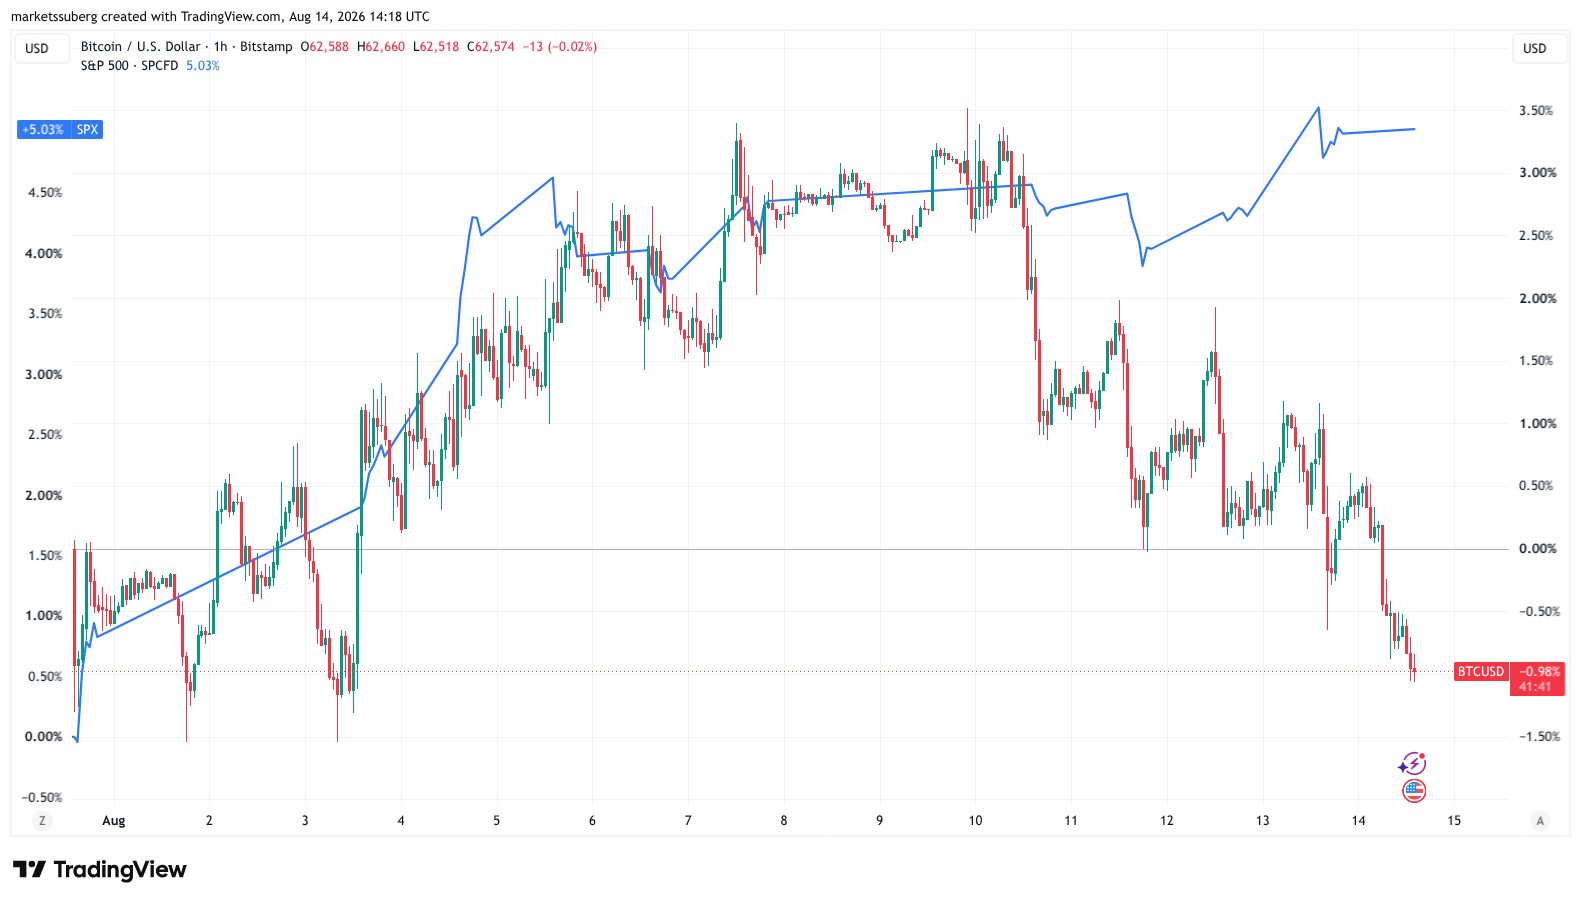
BTC/USD vs. S&P 500 one-hour chart. Source: Cointelegraph/TradingView
Commenting on Bitcoin price performance, trader and analyst Rekt Capital warned that Sunday’s weekly close needed to be above $63,220.
“A Weekly Close below the orange level would probably set price up for a breakdown,” he wrote in a post on X.
The analyst noted that $63,000 was now failing as support after weakening throughout August, having previously noted that the 50-month exponential moving average (EMA) at $65,827 was back as resistance, copying the 2022 bear market.
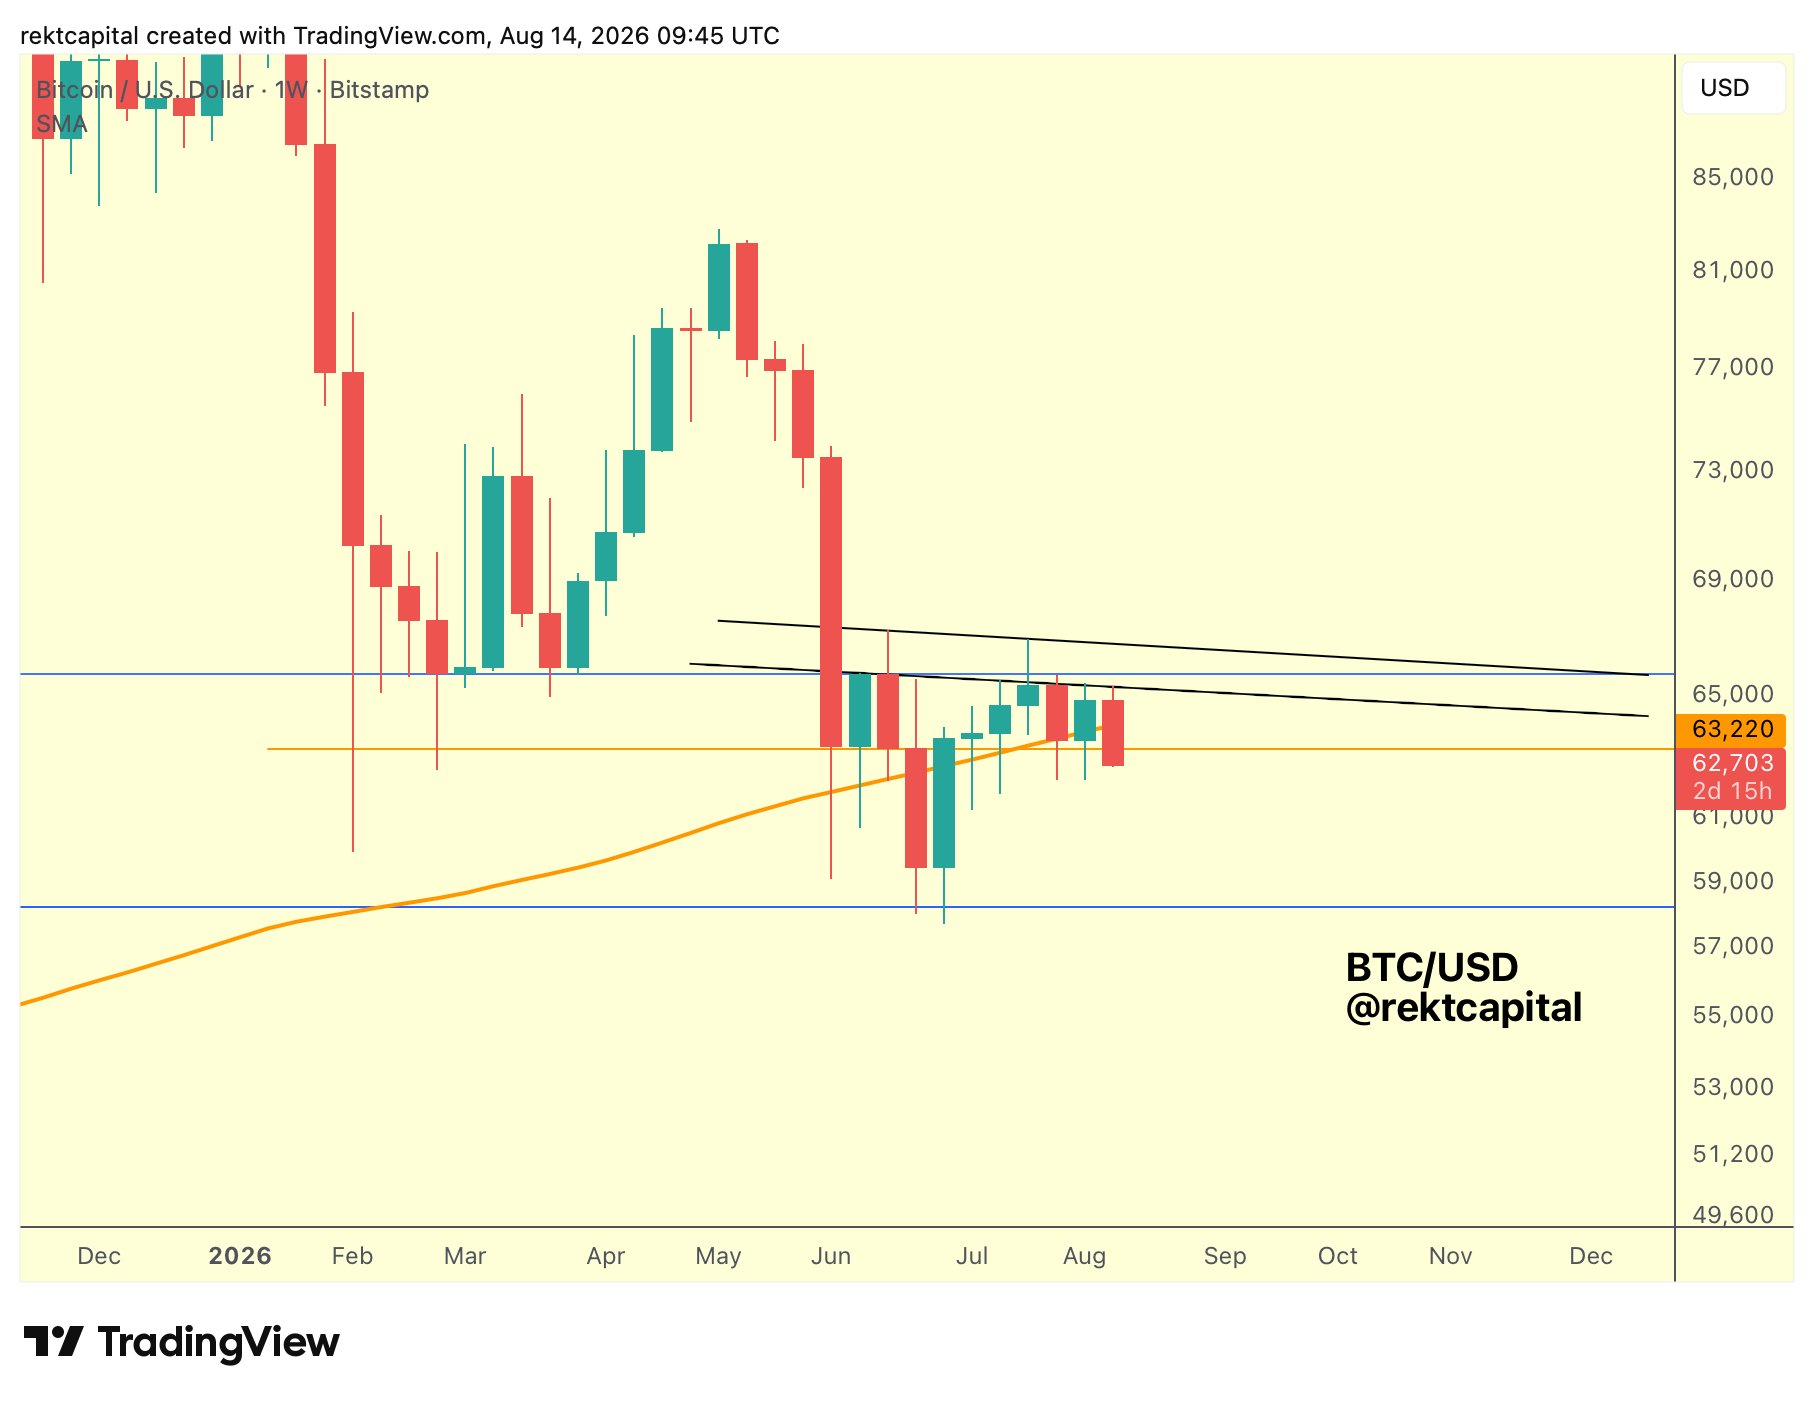
BTC/USD one-week chart. Source: Rekt Capital on X.com
Cointelegraph previously reported on increasing chances of a long liquidation event for Bitcoin as it approaches an area of liquidity around $61,000 amid growing open interest (OI) in derivatives markets.
“Traders have added substantial risk, most of it long, into a market that shows no matching demand,” onchain analytics platform Glassnode summarized in the latest edition of its regular newsletter, The Week Onchain.
In its latest analysis, trading and investment company QCP Capital drew attention to crypto markets’ refusal to rally on improving US inflation conditions — a phenomenon it described as “increasingly important.”
Related: Bitcoin speculators keep BTC price ‘pinned’ below $68.7K: Glassnode
“Last week, BTC demonstrated resilience in absorbing several negative headlines without a sustained breakdown,” it wrote, adding:
“This week has reinforced the distinction between resilience and momentum: the range remains intact, but softer inflation data have so far generated only a muted response from crypto.”
QCP added that macro traders are now focused on the Aug. 26 Personal Consumption Expenditures (PCE) index release, known as the Federal Reserve’s preferred inflation gauge. The index’s last print in July marked its first monthly decline since 2020, per data from the Bureau of Economic Analysis.
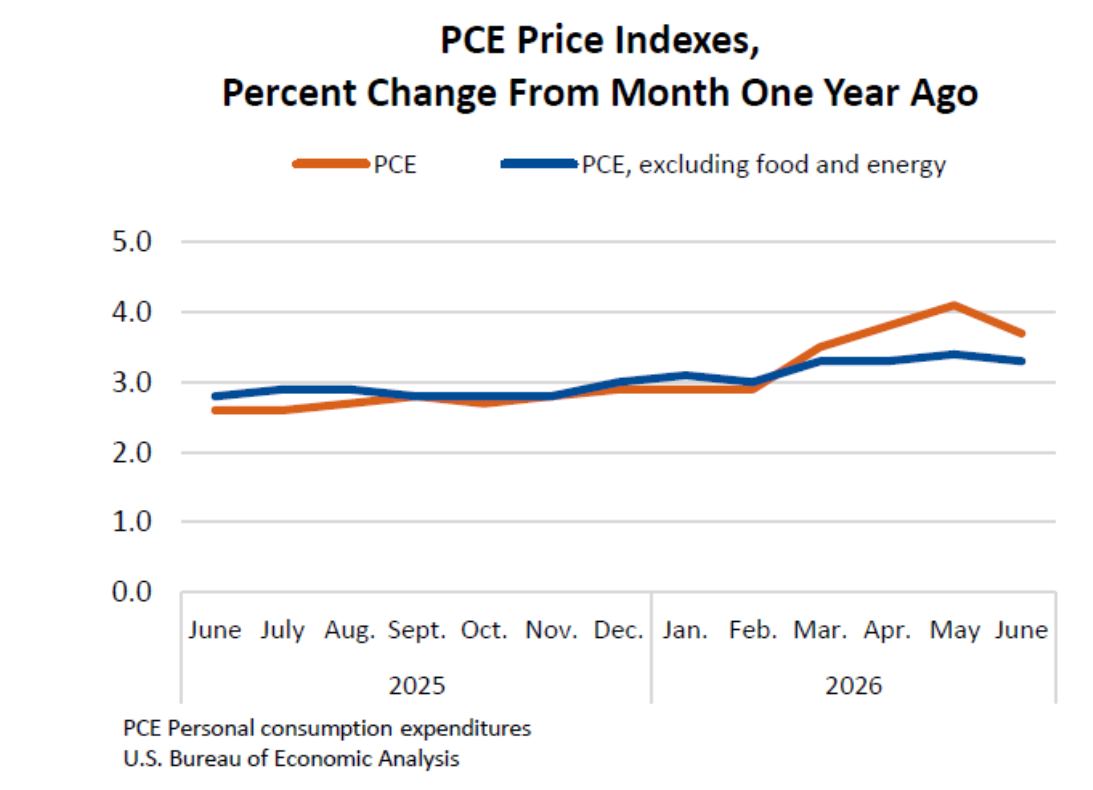
US PCE data percentage change (screenshot). Source: BEA

Ether’s (ETH) price has retraced by over 5.6% to $2,275 after being rejected by resistance at $2,400. Now, multiple data points suggest ETH/USD may drop below $2,000.
Key takeaways:
Ethereum’s network fundamentals are weakening, with weekly average transactions dropping by 10% to 4.79 million, per data from Nansen. Active addresses dropped by 8% to 2.5 million over the same period.
Related: Three reasons why Ether price rallies fizzle near $2.4K
Network fees also dropped by approximately 27%, leading to a 47% reduction in onchain revenue over the last seven days.
Blockchain comparison: Daily transactions, active addresses and network fees. Source: Nansen
Additional data from DefiLlama shows that the weekly DEX volumes dropped to $1.64 billion on May 8, a 46% drop over the last three weeks.
Low transaction count, a drop in active addresses and declining DEX volumes reflect reduced ecosystem usage. As a result, the total value locked (TVL) in Ethereum’s DeFi protocols has dropped to $124.7 billion, levels last seen in May 2025.

Total value locked on Ethereum. Source: DefiLlama
This subdued network activity signals weak user conviction, affecting Ether’s ability to sustain upside price momentum.
Ethereum’s unstaking queue jumped by approximately 72,000% within two weeks to 530,985 ETH on May 2.
As of Friday, over 202,000 ETH were queued for redemption, with a wait time of around three days.

Number of Ether queued for exit. Source: Validator Queue
The surge comes after a series of significant DeFi hacks, reflecting investor caution. April 2026 saw DeFi platforms suffer a record $625 million in monthly losses following 30 separate attacks, including a $292 million loss from the KelpDAO bridge hack, leading to over $15 billion in deposits withdrawn from the Aave platform.
These incidents have prompted investors to unstake ETH to regain liquidity, signaling flight from perceived risk.
“The exit queue went from ~700 ETH to ~500K ETH in 2 weeks,” analyst Pete said in a recent post on X, adding:
“DeFi yield on Ethereum is getting crushed by hacks, exploits and increasingly nasty attack surfaces.”
Despite the sharp surge in outflow pressure, 3.6 million ETH remains queued for staking entry (7x exit volume), pushing total staked ETH to 38.6 million (31.72% of supply) despite 45-day wait times.
The Ethereum Coinbase Premium Index, which tracks the price difference between ETH on Coinbase and Binance, has stayed negative since April 27.
A negative premium confirms that the selling pressure is originating heavily from US entities. As long as US investors are selling at a discount compared to the global market, downside momentum will likely accelerate.

Ethereum Coinbase Premium Index. Source: CryptoQuant
Additionally, US-based spot Ethereum ETFs snapped a four-day inflow streak with $103 million in net outflows on Thursday, the largest withdrawal since mid-March.

Spot Ethereum ETFs flows chart. Source: SoSoValue
Coupled with more than $81.6 million in outflows from global Ethereum investment products last week, this points to institutional selling, adding to Ether’s headwinds.
Meanwhile, ETH taker buy volume dropped to as low as -$25 million on Binance in recent days, indicating a “sharp increase in aggressive market sell orders,” CryptoQuant analyst BorisD said in a Quicktake note on Friday, adding:
“This structure raises the risk of short-term volatility and a support retest for ETH price action.”

ETH taker buy volume on Binance. Source: CryptoQuant
The daily chart shows the ETH/USD pair validating a rising wedge pattern after the price lost support at the pattern’s lower trend line at $2,300.
Bulls are now fighting to keep the price above $2,150-$2,200, where the 100-day and 50-week simple moving averages (SMAs) are, respectively.
Another key line of defense is the $2,000 psychological level, which, if breached, would clear the path for Ether’s drop toward the measured target of the wedge at $1,830, about 20% below the current price.

ETH/USD daily price chart. Source: Cointelegraph/TradingView
As Cointelegraph reported, the ETH price may descend to $1,750-$1,850 if support at $2,300 is not reclaimed in the short term.

Citigroup has cut its 12-month targets for Bitcoin and Ethereum, lowering its Bitcoin forecast to $112,000 from $143,000 and its Ethereum forecast to $3,175 from $4,304.
The March 17 revision marks a sharp step down from the bank’s December view and ties that reset to slower US legislative progress, a delay that Citi said is weighing on the policy support it had expected to help drive ETF demand and wider adoption.
The cuts are large enough to change the shape of the one-year crypto outlook without turning Citi bearish on the two assets.
Bitcoin’s new target is about 21.7% below Citi’s prior forecast, while Ethereum’s new target is about 26.2% below the earlier call. Both new targets still sit above current market prices.
Based on the latest CryptoSlate figures, Citi’s revised Bitcoin target still implies roughly 51.8% upside from spot, while its revised ether target implies about 36.8% upside.
Citi still expects Bitcoin and Ethereum to rise over the next year. But it has sharply lowered the ceiling it sees for both assets because the bank no longer expects the same pace of regulatory progress, institutional demand, and network follow-through that shaped its December forecasts.
For a market that has already bounced in recent weeks, the downgrade reads less like a call for immediate downside and more like a warning that the path higher may be slower and narrower than the earlier bull case assumed.
That warning lands as both assets have posted recent gains. Bitcoin trades around $74,000, up 4.5% over seven days, and 7.5% over 30 days. Ethereum sits near $2,300, up 12% over seven days, and 15% over 30 days.
The downgrade arrives as the market has recovered tactically, even as one of Wall Street’s largest banks has lowered its one-year expectations.

Citi’s revision follows a much more upbeat set of targets published in December. At that point, the bank set a 12-month Bitcoin target of $143,000 and a 12-month ether target of $4,304, while also outlining a Bitcoin bull case of $189,000 and an Ethereum bull case of $5,132 in a December report.
The earlier view leaned on regulatory easing and increased adoption. The new view keeps the basic upside case alive, but resets it lower because that policy timeline has not moved as fast as Citi expected.
In practical terms, the bank is saying the market may still move up over the next year, but the fuel it expected to push prices much higher has not arrived on schedule. That is a narrower and more cautious claim than the one Citi made at the end of last year. It also shifts the focus away from pure price prediction and toward the mechanism behind the forecast.
Citi’s December case depended on regulation, ETF demand, and adoption, reinforcing one another. Its March revision suggests that the sequence now looks less certain and less immediate.
The numbers show that clearly.
| Asset | Prior 12-month target | New 12-month target | Target cut | Current price | Implied upside to new target | 7-day move | 30-day move |
|---|---|---|---|---|---|---|---|
| Bitcoin | $143,000 | $112,000 | 21.7% | $73,777.10 | 51.8% | 4.55% | 7.51% |
| Ethereum | $4,304 | $3,175 | 26.2% | $2,320.12 | 36.8% | 12.7% | 15.38% |
The table captures the contradiction at the center of Citi’s revision. Prices have improved over the last week and month, especially for Ethereum, but Citi has still lowered its one-year targets. That suggests the bank is questioning whether the forces needed to sustain a larger move are strong enough to restore the December outlook.
That is especially relevant for Ethereum. Ethereum has outperformed Bitcoin over both the seven-day and 30-day windows in the latest market snapshot. Even so, Citi cut Ethereum’s target by a larger percentage than Bitcoin’s, pointing to a more cautious view of the medium-term case for ETH than short-term price action alone would suggest. In other words, recent strength has not been enough to offset Citi’s concerns around adoption, policy timing, and the broader demand backdrop.
For Bitcoin, the change is slightly different. Citi still sees more than 50% upside from current levels, which means the bank has not rejected the broader institutional case for BTC. But by cutting the target from $143,000 to $112,000, it has marked down how far that case can travel in the next year under current conditions.

That leaves Bitcoin with a still-positive but less expansive upside profile, one that depends more heavily on steady inflows and less on a rapid policy tailwind.

According to Farside, spot Bitcoin ETFs recorded $199 million in net inflows on March 16, bringing cumulative net inflows to $56.3 billion. Spot Ethereum ETFs posted $36 million in net inflows, with cumulative net inflows of $11.8 billion.
Those numbers show real demand is still present. But they also help explain why Citi’s revision is more nuanced than a simple bearish call. The issue is whether the current pace of flows, combined with a slower policy timeline, is strong enough to support the much higher targets Citi set in December. On that question, the bank’s answer now appears to be no.
That shift is easier to see when the December and March narratives are placed side by side. In December, Citi tied its targets to regulatory easing and wider adoption.
In March, it cut those same targets because US legislative progress had been slower than expected, according to the March 17 report. The underlying change is not that crypto prices have stopped moving. Citi is saying the policy and demand sequence it expected to amplify those moves has not come together fast enough.
That leaves markets in an unusual position. Bitcoin and Ethereum have both recovered in recent weeks. ETF money is still coming in. Yet a major bank has decided that the one-year payoff should be reduced anyway.
That gap between price performance and target revisions is the more useful signal. It says the market can rally in the short run without persuading every large forecaster that the longer-term setup has improved by the same degree.
It also explains why Citi’s downgrade does not read like a call on day-to-day trading. The bank is cutting a 12-month target, not predicting a near-term crash. That distinction matters. Targets are about the scale of the move over time, not whether prices can keep rising over the next few sessions or even the next few weeks.
By that standard, Citi’s message is straightforward: the market can still go up, but the room above spot is smaller than the bank thought a few months ago.

The main variable behind Citi’s reset is Washington. In January, Senate Banking Committee Chair Tim Scott announced a digital-asset market structure markup for Jan. 15, then postponed it on Jan. 14 as negotiations continued, according to the committee’s statement and follow-up update. Senators are still working to unlock the stalled CLARITY Act through a compromise tied to stablecoin yield.
That timeline shapes Citi’s reset because it is the clearest reason the bank has given for lowering its targets. A slower policy track delays legislation and weakens confidence that a friendlier rule set will arrive soon enough to accelerate ETF demand, corporate participation, and other forms of institutional adoption within the next year.
The mechanism is concrete: if the policy step slips, the adoption step can slip with it, making price targets tied to that adoption harder to defend.
For Bitcoin, the next question is whether spot ETF inflows can keep building even without a cleaner legislative backdrop. If they can, Citi’s new target could still prove conservative. If inflows flatten or lose momentum, the bank’s cut may look early rather than late.
The same structure applies to Ethereum, but with a tighter margin for error. Ethereum’s recent gains have been stronger, yet Citi’s target cut was deeper. That means ETH needs not only continued price support, but stronger evidence that usage and institutional demand can justify a higher one-year ceiling.
None of that requires a dramatic break in either direction. The data already in hand points to a narrower, more conditional setup. Citi still sees upside from current prices. ETF flows remain positive. Both Bitcoin and Ethereum have risen over the last month. But the one-year case now depends more heavily on whether policy negotiations start producing results and whether flows remain strong enough to replace the optimism Citi stripped from its December forecasts.
The next few months should show whether that caution was warranted. A legislative breakthrough, stronger ETF inflow streaks, or firmer adoption data could rebuild the case for higher targets.
More delays in Washington, softer flows, or weaker follow-through from recent market gains would support Citi’s decision to lower the bar.
For now, Citi’s revision leaves crypto with a live but reduced upside case, and with a clear test ahead, whether policy and demand can catch up to the prices that have already moved.

Bitcoin (BTC) bulls are eyeing a move back toward $80,000 in March, with at least three indicators flashing increasing upside momentum.
Key takeaways:
Bitcoin jumped by over 5% toward $72,000 on Wednesday.
Multiple indicators, including a symmetrical triangle, hint at an extended price rally toward $80,000.
On Wednesday, BTC’s price showed signs of invalidating what initially appeared to be a bear pennant.
The BTC/USD pair pierced the pennant’s upper trend line after jumping 5.21% to around $71,900. Its breakout came alongside a rise in trading volume, implying stronger conviction behind the rally.
That simultaneously increased the odds of a symmetrical-triangle bullish reversal.
A symmetrical triangle forms when price makes lower highs and higher lows, compressing into a tightening range.
It resolves when the price breaks either of the trendlines and moves by as much as the pattern’s maximum height.
In BTC’s case, the triangle’s widest range is roughly $63,000 to $71,000–$72,000.

A standard measured move above the upper trend line points to about $80,000 in March if the breakout sticks. The level aligns with BTC’s 100-day exponential moving average (100-day EMA, the purple line).
Related: US spot Bitcoin ETFs add $225M as BlackRock’s IBIT offsets redemptions
BTC’s next hurdle is the 50-day EMA (red) near $74,400. A rejection there would weaken the breakout and raise the odds of a pullback toward the 20-day EMA (green) around $68,700.
The triangle’s $80,000 measured target also overlaps with an unfilled CME futures gap, turning the area into a clear magnet zone for the bulls.
A CME gap happens because CME Bitcoin futures stop trading over the weekend. If Bitcoin’s spot price moves while the futures market is closed, the latter can reopen at a new level, leaving an empty price zone on the chart.

As of Wednesday, that gap has been sitting around $79,660–$81,210 since early February.
Nine of the last 10 CME gaps have been filled since August 2025, which is why traders may view the $79,660–$81,210 region as a high-priority target as spot and futures prices re-align.
Polymarket, a crypto-based prediction market where users trade contracts on real-world outcomes, is showing a clear bullish shift for BTC in March.
Traders now assign 40% odds that Bitcoin reaches $80,000 on Wednesday, up from 20% a day ago. The $75,000 target carries even stronger conviction at 70%, up from 40% yesterday.

At the same time, the odds of the BTC price reaching $65,000 and $60,000 in March are priced lower than before, suggesting the crowd is trimming downside expectations.
This article does not contain investment advice or recommendations. Every investment and trading move involves risk, and readers should conduct their own research when making a decision. While we strive to provide accurate and timely information, Cointelegraph does not guarantee the accuracy, completeness, or reliability of any information in this article. This article may contain forward-looking statements that are subject to risks and uncertainties. Cointelegraph will not be liable for any loss or damage arising from your reliance on this information.

Bitcoin (BTC) consolidated around $95,000 toward Wednesday’s Wall Street open as analysis dismissed macroeconomic threats.
While geopolitical risks and US trade policy uncertainty remain in focus, traders appeared more influenced by liquidity conditions and relative asset performance, with Bitcoin lagging gold and equities before reclaiming $95,000.
Key points:
Bitcoin prepares its next move after a key daily close above the 2025 yearly open.
Gold and stocks at all-time highs contrast the volatility risk from geopolitical tensions and the US Supreme Court tariff ruling.
BTC price action faces multiple hurdles, with $100,000 a turning point.
Data from TradingView showed cooler BTC price action returning after a run to two-month highs near $96,500.
These came as geopolitical tensions involving the US increased, including fresh potential intervention in Venezuela and Iran, as well as concerns over Greenland.
At the same time, the spat between the government and Federal Reserve took on an increasingly public character, with central banks worldwide rallying in support of Fed Chair Jerome Powell.
S&P 500 futures hit fresh record highs in advance of Tuesday’s US session, while gold built on existing records on the day, reaching $4,639 per ounce.

Among crypto market participants, the anticipation of Bitcoin finally catching up with the global asset bull run was noticeably high.
“Bitcoin has been lagging behind the equity market and precious metal rally, but it has finally pushed through the $95k level that capped rallies since November,” trading resource QCP Capital wrote in its latest “Asia Color” market update.
QCP added another risk-asset impetus to the mix in the form of Fed economic liquidity injections.
“With potentially further fiat currency debasement in the US, which has been driving precious metals higher, the relative cheapness of Bitcoin relative to precious metals at this point may spur a rotation to digital assets,” it continued.
QCP argued that despite current implied risks to market stability, traders were already one step ahead. Even President Donald Trump’s international trade tariffs being ruled illegal — with alleged multitrillion-dollar implications — should not disrupt the overall trend.
“Risks remain, notably the pending Supreme Court decision on tariffs and any escalation in Venezuela or Iran,” the update added.
“For now, the market continues to move higher in the face of these risks, which makes us believe this is already priced in. In the absence of a new unknown unknown, any further escalations should be a buy-the-dip opportunity.”
Others also found new reasons for optimism, among them Charles Edwards, founder of quantitative Bitcoin and digital asset fund Capriole Investments.
Related: Bitcoin loses to gold as debasement trade with BTC at 2-year lows: Analysis
“Strong Bitcoin move! Bitcoin just has its first promising technical move in a while,” he told X followers.
Edwards flagged a daily close above the 2025 yearly open level near $93,500 — Bitcoin’s first since Jan. 6.
“Opens up good odds of trend to $108K from here,” he added.
“Also need to see this weekly close above $93.5K to confirm the downside fakeout (bullish). Now would be a great time to turn this ship around!”

Trader Jelle spied what he called a “major” breakout from a descending triangle pattern in place since mid-November.
As Cointelegraph reported, some perspectives argued that this pattern was a relief bounce within a broader downtrend. Trader Roman, who predicted that BTC/USD would target $76,000 once downside reappeared, remained bearish.
“This is text book bearish price action: volume going up – price going down followed by volume going down – price going up/sideways,” he wrote about the weekly chart.
“Maybe we retest 100k area but this is nothing to get excited about. Next time large volume comes in, it’ll likely be a move lower.”

Trader CrypNeuvo, meanwhile, advised caution ahead of a potential resistance battle with Bitcoin’s 50-week exponential moving average (EMA) at $97,650.
“This could be a liquidity run towards the 1W50EMA where price could be rejected from,” he warned about the latest gains.
“Breaking above $100k (4% higher) is my invalidation to this idea.”

This article does not contain investment advice or recommendations. Every investment and trading move involves risk, and readers should conduct their own research when making a decision. While we strive to provide accurate and timely information, Cointelegraph does not guarantee the accuracy, completeness, or reliability of any information in this article. This article may contain forward-looking statements that are subject to risks and uncertainties. Cointelegraph will not be liable for any loss or damage arising from your reliance on this information.

Tony Kim
Dec 21, 2025 13:15
WLD price prediction shows potential recovery to $0.67 resistance if $0.47 support holds, with technical analysis suggesting mixed signals ahead for January 2025.
Worldcoin (WLD) trades at a pivotal moment as December 2025 draws to a close, with the token consolidating near crucial technical levels that will likely determine its trajectory into the new year. Our comprehensive WLD price prediction analysis reveals a market at crossroads, where technical indicators paint a mixed picture that demands careful examination.
• WLD short-term target (1 week): $0.54 (+5.9%) – aligned with EMA 12 resistance
• Worldcoin medium-term forecast (1 month): $0.47-$0.67 range – bounded by key support and resistance
• Key level to break for bullish continuation: $0.67 (Bollinger Band upper limit)
• Critical support if bearish: $0.47 (strong support confluence with 52-week low area)
The latest analyst predictions for WLD reveal a notable divergence in outlook that reflects the current market uncertainty. Recent WLD price prediction models from Coin Arbitrage Bot suggest relatively conservative targets, with short-term forecasts pointing to $0.54534 and medium-term projections reaching $0.55314. However, these AI-driven models also indicate a potential longer-term decline to $0.4542, highlighting the technical challenges facing Worldcoin.
More optimistic Worldcoin forecast scenarios emerge from traditional analysis sources, with Coinpedia targeting $1.60 in the medium term, representing a potential 213% upside from current levels. XT.com’s technical analysis suggests an even more aggressive short-term WLD price target of $1.36, contingent on key support levels holding firm.
This disparity between conservative algorithmic predictions and bullish technical analysis creates an interesting dynamic. The consensus appears to center around the critical $0.55 level, which aligns closely with our technical analysis showing this as a pivotal resistance zone.
Current Worldcoin technical analysis reveals a token positioned at a decisive juncture. Trading at $0.51, WLD sits precisely at its calculated pivot point, creating a neutral technical stance that could break either direction based on market catalyst and volume confirmation.
The RSI reading of 36.92 places Worldcoin in neutral territory, avoiding both overbought and oversold extremes. This positioning suggests the market has room to move in either direction without immediate technical constraints. However, the MACD histogram reading of -0.0018 indicates persistent bearish momentum, though the magnitude suggests this negative pressure is weakening.
Perhaps most telling is WLD’s position within the Bollinger Bands. With a %B reading of 0.1725, Worldcoin trades near the lower band at $0.47, indicating the token is approaching oversold territory on a volatility-adjusted basis. This positioning often precedes technical rebounds, particularly when combined with the current RSI levels.
The moving average structure presents a mixed picture for our WLD price prediction. While the token trades below all major moving averages (SMA 20 at $0.57, SMA 50 at $0.65), the proximity to the EMA 12 at $0.54 suggests potential for a short-term technical bounce if buying interest emerges.
The constructive scenario for our Worldcoin forecast centers on a successful defense of the $0.47-$0.50 support zone. If this critical level holds, WLD price prediction models suggest an initial target of $0.54, representing the EMA 12 resistance. Breaking above this level would open the path to $0.57 (SMA 20) and ultimately the primary WLD price target of $0.67, marking the Bollinger Band upper limit.
Volume confirmation will be crucial for this bullish thesis. The current 24-hour volume of $6.77 million on Binance represents moderate activity, but a sustained move above $0.54 would likely require volume expansion above $10 million to confirm genuine buying interest.
Technical catalysts supporting higher prices include a potential MACD bullish crossover if the histogram begins trending positive, and RSI momentum building toward the 50 neutral line. The key resistance cluster between $0.65-$0.67 represents the make-or-break zone for any meaningful WLD recovery.
The downside scenario in our WLD price prediction becomes active if the critical $0.47 support fails to hold. This level represents both the Bollinger Band lower limit and proximity to the 52-week low of $0.48, making it a technically significant zone.
A breakdown below $0.47 would target the psychologically important $0.45 level, aligning with some algorithmic predictions. Further weakness could extend toward $0.42, representing a -17.6% decline from current levels and matching more pessimistic long-term forecasts.
The bearish case gains credibility from the current positioning below all major moving averages and the persistent MACD negative histogram. Additionally, the distance of -73.69% from the 52-week high of $1.93 indicates WLD remains in a substantial downtrend that could continue if support breaks.
Based on our comprehensive Worldcoin technical analysis, the current risk-reward profile suggests a cautious approach with specific entry criteria. For traders asking whether to buy or sell WLD, the technical setup favors a wait-and-see approach until clearer directional signals emerge.
Bullish Entry Strategy: Consider initiating positions on a confirmed bounce from the $0.47-$0.49 support zone, with strict stop-loss placement at $0.46. Target the initial resistance at $0.54 for a potential 8-10% gain, with position scaling recommended if the move extends toward $0.57.
Risk Management: Given the current technical uncertainty, position sizing should remain conservative at 1-2% of portfolio allocation. The proximity to key support levels offers favorable risk-reward ratios, but the broader bearish momentum requires defensive positioning.
Confirmation Signals: Watch for RSI movement above 40 and MACD histogram turning positive as confirmation of trend reversal. Volume expansion above 24-hour averages would provide additional conviction for upward moves.
Our analysis suggests WLD faces a critical decision point in the coming weeks, with the $0.47-$0.51 range serving as the battleground for future direction. The most probable WLD price prediction scenario targets a recovery toward $0.67 resistance by January 2025, representing approximately 30% upside potential from current levels.
Confidence Level: Medium – Technical indicators provide mixed signals requiring confirmation
Key Levels to Monitor:
– Bullish confirmation above $0.54
– Bearish breakdown below $0.47
– Volume expansion for directional conviction
Timeline: The next 2-3 weeks will likely determine whether WLD can mount a sustainable recovery or faces further downside pressure. January 2025 represents the target timeframe for our primary Worldcoin forecast of $0.67, contingent on successful support defense and broader crypto market stability.
Investors should remain vigilant for volume confirmation and broader market sentiment shifts that could accelerate movement in either direction from these technically critical levels.
Image source: Shutterstock


