Sam Altman-backed World has rolled out biometric verification badges for Zoom enterprise users, aiming to combat AI deepfake impersonation and fraud.

 Live Chat

Sam Altman-backed World has rolled out biometric verification badges for Zoom enterprise users, aiming to combat AI deepfake impersonation and fraud.

Tokenized SpaceX exposure reportedly saw large liquidations, showing how crypto-style leverage is spreading into private-market equity products.
Tokenized SpaceX exposure has become a fresh example of how crypto-style leverage can spread into markets that were once far removed from perpetual futures and liquidation dashboards. Reports said leveraged bets tied to tokenized SpaceX stock suffered large liquidations as broader risk appetite weakened.
The story matters because tokenized private-market products are being pitched as a way to democratize access to high-demand companies. But when those products are paired with leverage, they can behave less like long-term equity exposure and more like a high-volatility crypto instrument.
SpaceX sits at the center of private-market demand because it combines brand power, scarcity and strong investor interest. Tokenized exposure to such a company can attract traders who would otherwise have no access to late-stage private equity. That demand is exactly why tokenized stock products are becoming more common.
But access does not remove risk. Tokenized products can be limited by jurisdiction, redemption terms, liquidity and the structure of the underlying claim. Traders may not be buying the same rights they would receive from direct stock ownership.
Tokenized equities remain one of the most important real-world asset narratives in crypto, but the SpaceX episode shows why market structure matters. It is not enough to tokenize an asset. Platforms also need clear rules around custody, pricing, leverage, disclosures and investor eligibility.
If tokenized private markets grow, regulators will likely pay close attention to whether products are being sold as access while behaving like leveraged derivatives. That makes this more than a SpaceX story. It is a warning about the next phase of crypto market structure.
The main point is not that one headline settles the direction of the market by itself. It is that the same themes keep showing up across the tape: regulation is becoming more specific, institutional products are moving closer to normal financial rails, and traders are reacting quickly whenever liquidity thins out. That is why the source detail matters here. The development gives the market one more data point at a time when Bitcoin, Ethereum and the wider altcoin complex are already being judged through the lens of leverage, policy risk and institutional participation.
The practical reading is that this story belongs inside the wider market structure rather than as an isolated announcement. Traders are still working through a mix of weaker liquidity, tougher policy questions, institutional product launches and renewed stress in high-beta tokens. That means even stories that look narrow at first can become useful because they show where capital, regulation and infrastructure are moving. The safest framing is to avoid treating the development as a guaranteed price catalyst and instead focus on what it changes for market participants, builders and investors watching the next stage of crypto adoption.
This coverage is based on information from Backpack Exchange data.
This article was written by the News Desk and edited by Samuel Rae.

Editorial Process for bitcoinist is centered on delivering thoroughly researched, accurate, and unbiased content. We uphold strict sourcing standards, and each page undergoes diligent review by our team of top technology experts and seasoned editors. This process ensures the integrity, relevance, and value of our content for our readers.

Terrill Dicki
Mar 12, 2026 08:38
Cardano (ADA) trades at $0.26 with neutral RSI at 44.50. Technical analysis suggests potential bounce to $0.30 resistance level, though bearish MACD momentum persists.
Cardano (ADA) is displaying mixed technical signals as it consolidates around the $0.26 price level. With trading volume reaching $33.9 million on Binance and key indicators showing neutral to bearish momentum, traders are watching for directional confirmation in the coming sessions.
• Short-term target (1 week): $0.30
• Medium-term forecast (1 month): $0.25-$0.30 range
• Bullish breakout level: $0.30 (upper Bollinger Band)
• Critical support: $0.25 (lower Bollinger Band)
While specific analyst predictions from key opinion leaders are limited in recent sessions, available technical analysis from Blockchain.News suggests mixed sentiment for ADA. According to their March 9 analysis, “ADA trades at $0.25 with neutral RSI at 41.30. Technical analysis suggests $0.27 resistance test possible, while AI models project ambitious $3.25+ targets by year-end.”
The publication’s earlier March 8 report indicated similar technical patterns, noting that “ADA trades at $0.25 with mixed signals as RSI sits neutral at 39. Technical analysis suggests potential bounce to $0.30 resistance, but bearish momentum persists across key indicators.”
According to on-chain data platforms, Cardano’s current market structure reflects consolidation patterns typical of assets preparing for directional moves, though the specific direction remains uncertain given the mixed technical signals.
Cardano’s current technical picture presents a nuanced outlook with several key indicators worth monitoring:
RSI Analysis: The 14-period RSI sits at 44.50, firmly in neutral territory. This reading suggests neither oversold nor overbought conditions, leaving room for movement in either direction. The neutral RSI aligns with the current consolidation phase.
MACD Momentum: The MACD indicator shows bearish undertones with a reading of -0.0084 and a matching signal line. The histogram at 0.0000 indicates minimal momentum, suggesting the bearish trend may be losing strength but hasn’t yet reversed.
Bollinger Bands Position: ADA is currently positioned at 0.34 within the Bollinger Bands, closer to the lower band ($0.25) than the upper band ($0.29). This positioning suggests the asset is trading in the lower portion of its recent range, potentially setting up for a bounce toward the middle band at $0.27.
Moving Average Structure: The short-term moving averages show ADA below key resistance levels, with the SMA 20 at $0.27 and SMA 50 at $0.29 both serving as immediate overhead resistance. The SMA 200 at $0.51 remains significantly higher, indicating the longer-term trend challenge.
In a bullish scenario for this ADA price prediction, Cardano could target the $0.30 level, representing the upper Bollinger Band and a key psychological resistance area. Technical confirmation would require:
A successful break above $0.30 could open the door for a test of the $0.35-$0.40 range, though this would require broader market cooperation and fundamental catalysts.
The bearish case for this Cardano forecast centers around a breakdown below the $0.25 support level. Risk factors include:
A break below $0.25 could target the $0.20-$0.22 zone, where previous support levels might provide some buying interest.
Based on current technical levels, potential entry strategies include:
Conservative Approach: Wait for a clear break above $0.27 with volume confirmation before initiating long positions. This approach reduces risk but may result in missing early move profits.
Aggressive Approach: Consider accumulating near the $0.25-$0.26 support zone with tight stop-losses below $0.24. This strategy offers better risk-reward ratios but carries higher probability of stopped-out positions.
Risk Management: Regardless of entry strategy, position sizing should account for ADA’s daily ATR of $0.02, suggesting potential daily moves of 7-8% are normal. Stop-losses below $0.24 for long positions help limit downside exposure.
This ADA price prediction suggests Cardano is at a critical juncture, with the potential for a move toward $0.30 resistance if bullish momentum emerges. However, the mixed technical signals warrant caution, and traders should prepare for continued range-bound trading between $0.25-$0.30 until clearer directional signals emerge.
The neutral RSI and weakening bearish MACD momentum provide some optimism for bulls, but confirmation through volume and price action remains essential. The Cardano forecast for the coming weeks largely depends on whether ADA can reclaim and hold above the $0.27 level.
Disclaimer: This price prediction is based on technical analysis and market data available as of March 12, 2026. Cryptocurrency investments carry significant risk, and past performance does not guarantee future results. Always conduct your own research and consider your risk tolerance before making investment decisions.
Image source: Shutterstock

Timothy Morano
Feb 15, 2026 10:26
AAVE trades at $129.03 with neutral RSI at 48.60. Technical analysis suggests potential upside to $135-140 range within 4-6 weeks, though bearish MACD signals caution for short-term traders.
• Short-term target (1 week): $132-135
• Medium-term forecast (1 month): $125-140 range
• Bullish breakout level: $135.18
• Critical support: $122.64
While specific analyst predictions are limited for the current period, on-chain data from major platforms suggests mixed sentiment around AAVE’s current price action. According to technical data from exchanges, the token is experiencing consolidation after recent volatility, with trading volume remaining steady at approximately $14.9 million over the past 24 hours.
Market data indicates that institutional interest in DeFi protocols like Aave continues to drive longer-term adoption, though short-term price movements remain heavily influenced by broader cryptocurrency market sentiment and technical trading patterns.
The current AAVE price prediction relies heavily on several key technical indicators showing mixed signals. At $129.03, AAVE sits comfortably above its 7-day and 20-day simple moving averages ($117.26 and $124.88 respectively), indicating short-term bullish momentum despite recent consolidation.
The RSI reading of 48.60 places AAVE in neutral territory, suggesting neither overbought nor oversold conditions. This neutral positioning often precedes significant price movements in either direction, making the next few trading sessions critical for determining trend direction.
The MACD histogram at 0.0000 indicates bearish momentum, with the MACD line (-8.9463) matching the signal line exactly. This convergence often signals potential trend changes, though the negative values suggest underlying bearish pressure remains present.
Bollinger Bands analysis shows AAVE trading at 0.57 position between the bands, with the upper band at $156.27 and lower band at $93.48. This positioning suggests room for upward movement before reaching overbought territory.
The Stochastic oscillator presents a more bullish picture, with %K at 92.57 indicating strong upward momentum, though this reading also suggests the token may be approaching overbought levels in the short term.
The Aave forecast turns optimistic if AAVE breaks above the immediate resistance at $132.10. A successful break of this level would likely target the strong resistance at $135.18, representing approximately 5% upside from current levels.
Beyond $135.18, the next major target aligns with the Bollinger Band upper limit around $156, though reaching this level would require significant volume and broader market support. The bullish case strengthens if AAVE can maintain above the 20-day SMA of $124.88 while building volume on any upward moves.
Technical confirmation for the bullish scenario would include RSI breaking above 60, MACD histogram turning positive, and sustained trading above $132 for multiple sessions.
The bearish AAVE price prediction scenario activates if support at $125.83 fails to hold. A break below this level would likely test the strong support at $122.64, representing potential downside of approximately 5%.
More concerning would be a break below the 7-day SMA at $117.26, which could signal a return to lower trading ranges and test the psychological $100 level. The current MACD negative reading supports this bearish potential, especially if broader cryptocurrency markets face headwinds.
Risk factors include the significant gap between current price and longer-term moving averages (50-day SMA at $147.52 and 200-day SMA at $220.06), indicating AAVE remains well below its longer-term trend.
Based on current technical levels, the optimal entry strategy for AAVE involves waiting for clear directional confirmation. Conservative buyers should consider entries near the $125.83 support level with stop-losses placed below $122.64.
More aggressive traders might consider buying any dip toward $128.91 (pivot point) with targets at $132.10 and $135.18. However, the mixed technical signals suggest position sizing should remain modest until clearer trends emerge.
Risk management remains crucial given AAVE’s daily ATR of $10.69, indicating significant volatility potential. Traders should avoid overleveraging and maintain strict stop-loss discipline given the current technical uncertainty.
The AAVE price prediction for the coming weeks suggests cautious optimism with upside potential to the $135-140 range, contingent on breaking immediate resistance levels. While technical indicators show mixed signals, the neutral RSI and consolidation pattern suggest AAVE may be preparing for its next significant move.
Investors should monitor the $132.10 resistance break as a key catalyst for the bullish scenario, while remaining aware that failure to hold $125.83 support could trigger deeper retracement. The Aave forecast remains constructive for patient investors, though short-term traders should exercise caution given current market conditions.
This analysis is for educational purposes only and should not be considered financial advice. Cryptocurrency investments carry significant risk, and past performance does not guarantee future results. Always conduct your own research and consider your risk tolerance before investing.
Image source: Shutterstock

As the Web3 ecosystem shifts toward utility-focused projects, SHOW Token emerges as a blockchain-based initiative applying artificial intelligence (AI) and Web3 infrastructure to the film industry. The project explores how on-chain participation and AI-assisted workflows can address long-standing inefficiencies in film production.
SHOW Token is designed as a utility token within an AI-driven cinematic platform. Rather than functioning purely as a speculative asset, the token is integrated into platform usage, enabling access, engagement, and participation across the ecosystem.
Traditional film production often struggles with opaque funding structures, limited access for independent creators, and inefficient creative workflows. SHOW Token’s ecosystem combines blockchain transparency with AI-powered production tools to create clearer participation models and more efficient processes.
From a technical standpoint, blockchain infrastructure supports transparent contribution tracking and clearer value flow between creators and contributors. This helps reduce reliance on closed networks and intermediaries that commonly exist in traditional production models.
Artificial intelligence serves as a workflow optimization layer. AI-assisted tools are intended to support ideation, pre-visualization, and production efficiency, allowing creators to reduce operational friction while maintaining creative control. This reflects a broader industry trend where AI enhances productivity rather than replacing human creativity.
SHOW Token emphasizes long-term ecosystem development and real platform usage over short-term price narratives. The project remains in an early development phase, focusing on building foundational infrastructure rather than making speculative claims.
By aligning AI technology, blockchain participation, and utility-driven token design, SHOW Token positions itself within a growing category of Web3 projects targeting real-world creative industries.
More information about the project’s vision and ongoing development is available at https://showtoken.io/
Disclaimer: The information provided in this press release is not a solicitation for investment, nor is it intended as investment advice, financial advice, or trading advice. Investing involves risk, including the potential loss of capital. It is strongly recommended you practice due diligence, including consultation with a professional financial advisor, before investing in or trading cryptocurrency and securities. Neither the media platform nor the publisher shall be held responsible for any fraudulent activities, misrepresentations, or financial losses arising from the content of this press release.

Bitcoin long-term holders showed early capitulation as LTH SOPR dipped below 1.0, signaling some six-month-plus holders sold at a loss.
Bitcoin (BTC) is showing early signs of strain among long-term holders as the LTH SOPR (Spent Output Profit Ratio) recently fell below 1.0, signaling that some holders are starting to sell at a loss.
While isolated, this move reflects growing uncertainty in the market as BTC trades near $92,000 amid mixed technical signals.
This development is significant because those holding BTC for more than six months have historically provided stability during price corrections. Their tentative selling could hint at short-term weakness or a shift in sentiment following months of accumulation.
The Long-Term Holder SOPR measures whether BTC moved on-chain is being sold at a profit or loss. A value above 1.0 indicates profit-taking, while a drop below 1.0 signals capitulation, where holders sell at a loss.
According to analysis shared on January 13 by market watcher Darkfost, the metric for Bitcoin held for more than six months briefly slipped under this threshold. This behavior, they said, is typically associated with bear market phases and points to selling pressure from “younger” long-term holders who bought within the last 9 months and are now in the red.
This development is happening alongside a notable reduction in positions by large investors. As previously reported, addresses holding between 1,000 and 10,000 BTC have parted with 220,000 BTC over the past year, the fastest rate of decline since early 2023.
While the 30-day average LTH SOPR remains positive at 1.18, it sits well below the annual average near 2.0, reflecting an overall drop in realized profits.
The market now presents a clash of narratives. The LTH SOPR hints at strain, but other analysts are pointing to potentially constructive technical patterns. Chartist Egrag Crypto highlighted a “hidden bullish divergence” on Bitcoin’s weekly chart, where price forms higher lows while the RSI momentum indicator makes lower lows, which can precede trend continuation.
Furthermore, the Sell-Side Risk Ratio, a measure of the scale of profits and losses being realized, has returned to levels last seen in October 2023, implying distribution is happening with less conviction.
Looking ahead, the path for BTC appears contingent on a clear break from its current range. Over the past week, it has traded between roughly $90,000 and $92,400, showing modest volatility. In the last 24 hours, the price rose 1.7% to around $92,200, with short-term holders nearing profitability, as noted by investor CW.
Meanwhile, analysts suggest that reclaiming the $92,000–$94,000 zone could trigger renewed buying, but repeated resistance attempts, potentially the eighth or ninth in recent weeks, per Ted Pillows, may exhaust momentum.

Start every day with the top news stories right now, plus original features, a podcast, videos and more.

On a cold ‘Betwixmas’ December morning, the mood around Bitcoin feels familiar and strange at the same time.
Familiar, because the story still swings between euphoria and anxiety. Strange, because the people watching the chart now include a different crowd.
Market Cap $1.74T
24h Volume $43.03B
All-Time High $126,173.18
Some are still the veterans who lived through 2017 and 2021, some are newer, the ones who got exposure through a brokerage account and an ETF ticker, the kind of investor who never had to learn what a seed phrase is.
Bitcoin is trading around $89,000. That number would have sounded ridiculous a few years ago, and it still does if you zoom out. Yet it also feels like a comedown, because only weeks ago, the market was living through a peak near $126,000 and then the fall that followed.
That drop was pinned, in part, on rising Treasury yields, tariffs, and ETF outflows, a reminder that Bitcoin now breathes the same air as the rest of global risk markets.
Which sets up the real point for 2026.
If Bitcoin prints a fresh all-time high next year, after already topping in 2025, it changes the emotional rhythm that people have built their expectations around.
Traders call it the four-year cycle, the halving shows up, supply issuance drops, a big rally follows, then the hangover. Everyone has their own version, but the timing pattern has acted like a metronome.
A 2026 all-time high would be more than another green candle. It would be a signal that the metronome is losing its grip, and that something else is now keeping time.
The “four-year cycle” idea is built on a clean premise: every halving reduces new supply, the market tightens, price runs, then the cycle exhausts, and a deep drawdown clears out leverage and excess.
Historically, the most prominent peaks often arrived about a year to a year and a half after a halving. In the classic telling, the halving is the match, the rally is the fire, and the second year is where the fire burns out.

The reason 2026 matters is that it sits on the wrong side of that old calendar. The most recent halving happened in 2024; the market already pushed into new highs before the halving in a way that caught plenty of people off guard, then it pushed higher again in 2025. If Bitcoin goes on to set another meaningful high in 2026, it starts to look less like a neat four-year pulse and more like a longer macro cycle with corrections along the way.
That difference matters for anyone trying to write the next chapter, and it matters for the people whose lives are tied to these moves, the retail holders who measure time in bull markets, the founders who time fundraising windows, the miners who live and die by margins, the institutions that now have to explain their exposure in quarterly letters.
Bitcoin would need to take out the prior high near $126,000. From roughly $89,000 today, that is about a 42 percent climb.
That is not a moonshot by Bitcoin standards, it is also not free. In plain compounding terms, the market would need something like 3 percent a month on average to get there by the end of 2026, or closer to 6 percent a month to do it by mid-year.

Real markets do not move in smooth lines, but the math is useful because it tells you what the hill looks like before you start arguing about weather.
When you ask what needs to happen for that climb to be plausible, you end up back at three forces that have become harder to ignore over the last two years.
Rates, flows, and access.
Those three factors are also the most legible way to talk about a cycle break without turning it into astrology.
After the 2024 halving, the network creates about 450 new Bitcoin a day. At roughly $89,000 per coin, that is about $40 million of new supply value per day, around $15 billion over a year at current prices.
This is not a perfect proxy for sell pressure. Miners do not sell every coin, and long-term holders and exchanges add their own dynamics. Still, as a back of the envelope reality check, it works.

If the market wants higher prices, someone has to absorb supply, and the absorption has to be persistent enough to matter. This is where the ETF era becomes the core of the 2026 debate.
Citi’s forecast for 2026 puts a price target around $143,000, and it includes a rough expectation of around $15 billion in ETF inflows. Whether you agree with that target or not, it gives a useful way to frame the year, because that flow number is on the same order of magnitude as a year of post-halving issuance value.

If ETFs, corporates, and other allocators collectively bring in net new demand that matches or exceeds the flow of new supply for long stretches, a new all time high becomes a plausible outcome without requiring a retail mania. If flows stall, or reverse, then Bitcoin has to climb while fighting both gravity and its own reflexes, and the odds shift.
CoinShares data shows that the ETP market is already large enough to leave fingerprints. There have been strong inflow weeks, the yearly total in 2025 still looks big in absolute terms, and the drawdowns in AUM show how quickly risk appetite can change.
So 2026 becomes a year where the question is less about whether Bitcoin’s code will keep doing what it always does, and more about whether the people and institutions around it keep choosing to hold, add, and distribute it.
Picture the kind of investor who used to scoff at Bitcoin, then quietly bought exposure through an ETF when it became administratively easier.
That person is not usually thinking about halving cycles, they are thinking about opportunity cost, correlation, and what their portfolio gets paid to do while it waits.
Real yields have been a major part of the story in late 2025, and the narrative around the price drop after the October peak leaned on rising Treasury yields alongside ETF outflows. In that world, Bitcoin trades more like a high-beta asset, and it’s treated as optional when the safe alternative pays.
For Bitcoin to print a new high in 2026, you would usually expect at least one of two things to change.
Either real yields stop rising and start easing, which makes non-yielding assets easier to own, or Bitcoin’s demand becomes strong enough that it shrugs off higher yields.
The first path is the cleaner one, and it is the more traditional macro setup for risk assets and alternative stores of value. The second path is the one that would truly feel like a regime shift, and it likely requires something bigger, broader access, more persistent institutional accumulation, and a market that has absorbed the ETF structure into its normal functioning.
The most underappreciated part of the last two years is how much the buying process has changed.
Bitcoin used to require friction. You had to sign up somewhere, learn a new interface, and accept a kind of personal responsibility that most investors did not want. That friction served as both a demand limiter and a safety barrier.

Now the friction is lower. ETFs have made it easier to buy, and the next step is for brokerages and banks to go further, which Reuters reporting suggests is exactly what parts of Wall Street are exploring. If spot crypto trading becomes embedded inside mainstream brokerage platforms, the number of potential marginal buyers expands again, including people who will never open a crypto exchange account.
This matters for 2026 because access can change the shape of demand.
Retail manias tend to be bursty, you get a flood, then a drought. Allocations through familiar financial plumbing can be slower, stickier, and more boring, which is also another way of saying it can extend a trend and stretch timing expectations.
A cycle break does not have to look like fireworks, it can look like a grind.
Here is the part most cycle arguments skip, probability.
We can model Bitcoin’s chance of touching a new all-time high with a simple approach that traders and risk managers have used for decades, a stochastic process where price wiggles with volatility, and drifts upward or downward based on the expected return environment.
You can debate the assumptions, and you should, but it gives a disciplined way to talk about outcomes.
Using today’s price near $89,000, an all-time high barrier at $126,000, and an annualized volatility estimate around 41 percent from CF Benchmarks’ BVX, we can plug in a drift assumption based on a real-world forecast, Citi’s $143,000 target for 2026 implies a positive drift consistent with that year-end level.

With those inputs, the model gives a probability in the rough neighborhood of 70 percent that Bitcoin touches a new all-time high at least once during 2026.
That is a conditional statement, and it says something important.
With volatility this high, Bitcoin does not need an immaculate rally path to print a new high, it needs enough positive drift so that the random swings have a favorable bias.
Then we can extend the horizon out to the estimated 2028 halving window. Under the same drift assumption, the probability that Bitcoin fails to print a new all-time high at any point before the 2028 halving falls into single digits.
If you assume a more conservative path, strong momentum in 2026 followed by a cooler, consolidating 2027 into early 2028, that failure probability rises into the mid-teens.

The “no new high before the next halving” outcome is possible, and it becomes meaningfully more likely if 2027 turns into a risk-off digestion year. The market’s base case, under optimistic drift assumptions, still leans toward another high before 2028.

If you strip away the jargon and keep it grounded, the conditions look like this.
Put those together, and a 2026 all-time high stops sounding like a magical break of fate; it starts sounding like an extension of a structural shift that began when the market moved on chain demand into traditional financial wrappers.

If Bitcoin does break out again in 2026, the next phase becomes the more interesting one.
In the old cycle script, 2027 would be the year where the air comes out, the market bleeds, and everyone waits for the next halving like a scheduled sunrise.
A cycle break changes that emotional pacing.
It changes the context. Corrections become something you manage inside a broader trend rather than something that ends an era.
A reasonable expectation, if 2026 prints a meaningful new high, is that 2027 turns into a consolidation year rather than a full reset. Volatility can compress as the buyer base becomes more institutional, and the market starts to behave more like a macro asset with crypto-specific catalysts rather than a standalone casino.

The halving in 2028 then becomes less of a sudden shock and more of a committee event, a date that asset allocators can plan around, with the story framed as incremental tightening in supply against an expanding access layer.
That kind of market can still rally post-halving, and it can still sell off sharply. The difference is that the driver is no longer only the ritual of the cycle; it is the interaction of liquidity, flows, and risk appetite.
If you follow that path out one more step, 2029 starts to look like a year where Bitcoin’s biggest question is identity.
In a world where access is mainstream and regulation is clearer, Bitcoin has to prove what role it plays when the novelty is gone. Some people will keep treating it like digital gold, some will treat it like a levered bet on liquidity, some will treat it like a strategic reserve asset, especially if sovereign signaling continues to evolve.

This is where the “human interest” part comes in.
The most important shift is not that the chart breaks a pattern, it is that the people holding Bitcoin may no longer share the same time horizon or the same reasons for owning it.
The retail holder checking price on a phone during a commute, the miner watching margins, the founder building a company, the portfolio manager trying to justify exposure to a committee, they all pull on the market in different ways, and those different ways can smooth the old extremes while still leaving plenty of room for drama.
A 2026 all-time high would be a headline. The deeper story is the slow replacement of a folklore cycle with a more grown-up, more complicated engine.
If the market wants that outcome, 2026 is the year it has to earn it, through flows that stick, a macro backdrop that stops fighting, and access that keeps widening, so that Bitcoin’s next peak feels less like a once every four years event and more like part of a longer, messier march into the mainstream.
At the time of press 11:46 pm UTC on Dec. 26, 2025, Bitcoin is ranked #1 by market cap and the price is up 0.21% over the past 24 hours. Bitcoin has a market capitalization of $1.74 trillion with a 24-hour trading volume of $42.95 billion. Learn more about Bitcoin ›
At the time of press 11:46 pm UTC on Dec. 26, 2025, the total crypto market is valued at at $2.95 trillion with a 24-hour volume of $98.12 billion. Bitcoin dominance is currently at 59.15%. Learn more about the crypto market ›
Bitcoin
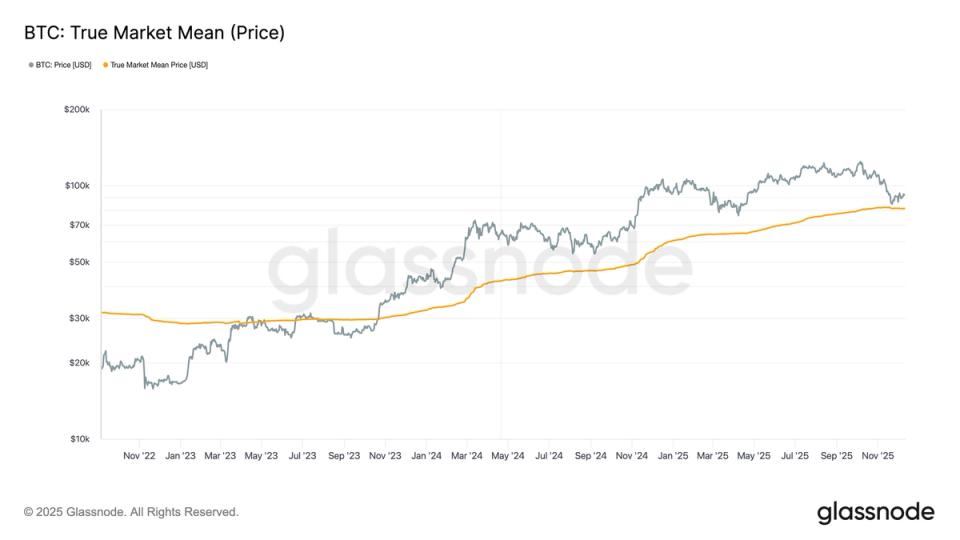
These metrics help to identify where investors are most likely to defend positions during drawdowns. The area of support proved vital, as it aligned closely with the average acquisition prices of multiple investor cohorts.
First, the True Market Mean, represents the average onchain purchase price of bitcoin held by active market participants. It focuses on coins that have moved recently, filtering out long dormant supply, and therefore reflects the cost basis of investors who are most likely to trade.
During this pullback, the True Market Mean sat near $81,000 and acted as clear support. Notably, bitcoin first moved above this level in October 2023 and had not traded below it since, reinforcing its importance as a structural bull market threshold.
Second, the U.S. spot ETF cost basis reflects the weighted average price at which bitcoin has flowed into U.S. listed spot ETFs. This is calculated by Glassnode using the combined daily ETF inflows with the market price.
The average cost basis currently sits around $83,844, according to Glassnode, and bitcoin once again bounced off this level, which it similarly did during the April tariff-driven selloff.
The third metric, the 2024 yearly cost basis, tracks the average price at which coins acquired in 2024 were withdrawn from exchanges. CoinDesk Research has shown a pattern that yearly cohort cost bases tend to act support during bull markets.
In this case, the 2024 cost basis near $83,000, according to checkonchain, provided additional confirmation of demand, again was also seen as support during the April correction.

These metrics highlight the depth of demand of support in the $80,000 region.

Aliens more probable than a $200K Bitcoin? Polymarket bettors seem to think so.
Investor sentiment flipped sharply bearish as Bitcoin (BTC) and major crypto assets succumbed to macroeconomic pressures. Polymarket’s latest tweet has injected a fresh dose of skepticism into the Bitcoin narrative.
The decentralized prediction market humorously noted that the odds of aliens being confirmed this year (6%) slightly surpass Bitcoin hitting $200,000 (5%). Yet beneath the levity, Polymarket’s data highlighted a more serious near-term risk.
Polymarket is seeing a 52% chance that Bitcoin could crash below $100,000 this month. This is in line with the broader market unease, as crypto analyst Ted Pillow recently stated that Bitcoin has already lost its critical $108,000 support level, which has left a minimal buffer until $101,000-$102,000. Pillow stated that a reclaim of $110,000 could trigger a short-term bounce, but otherwise, traders should brace for more pain before relief arrives.
Adding to the cautionary sentiment, Doctor Profit, another popular market analyst, called the current environment the “early phase of the bear market,” which is seeing intense deceptive mini-rallies and sharp downside moves. He predicted the macro bottom would eventually settle between $60,000-$70,000.
According to Doctor Profit, traders should expect increasing selling pressure, with the Fear & Greed Index likely reaching extreme fear levels in the coming days, further backed by the red numbers across the charts. As such, these factors paint a picture of a market navigating a precarious balance.
“Remember, dead cat bounces are the biggest enemy for us shorts. Play them or ignore them, but don’t fight them.”
Macro uncertainty continues to weigh heavily on Bitcoin, and Glassnode revealed a major change in sentiment across markets and derivatives. Over the past week, gold has outperformed Bitcoin by more than 20%, reclaiming part of its “store-of-value” appeal. This was indicative of investors’ growing caution toward crypto.
This caution has spilled over into the options market. Short-dated BTC volatility spiked sharply overnight, while front-end options traded around 50 vol as traders paid up for immediate downside protection. BTC skew still behaves like a macro asset, favoring puts – downside protection remains pricier than upside exposure amidst defensive positioning. The market is balanced, as seen with some accounts rolling protection lower, others selling volatility on the dip, and a few selectively buying cheap calls. Overall, the tone is cautious but not one-sided.
Broader volatility metrics confirm this defensiveness. Put-heavy skew, bid wing vols, and strong demand for tail hedges indicate traders remain focused on downside risk. Year-end upside exposure has cooled as downside vol continues to dominate. For those willing to take risks, selling puts or put spreads to finance November topside remains a viable strategy.
LIMITED OFFER for CryptoPotato readers at Bybit: Use this link to register and open a $500 FREE position on any coin!


