Sentora has proposed operating independently curated lending markets on Aave V4, starting on Ethereum, with half of the instance's protocol revenue going to the Aave DAO. The Aave Request for Final Comments, or ARFC, remains at the community-feedback stage. It calls for a Snapshot vote followed, if… Read the full story at The Defiant

share
Why Bitcoin bulls shouldn’t mistake a shrinking dollar reserve share for central bank buying
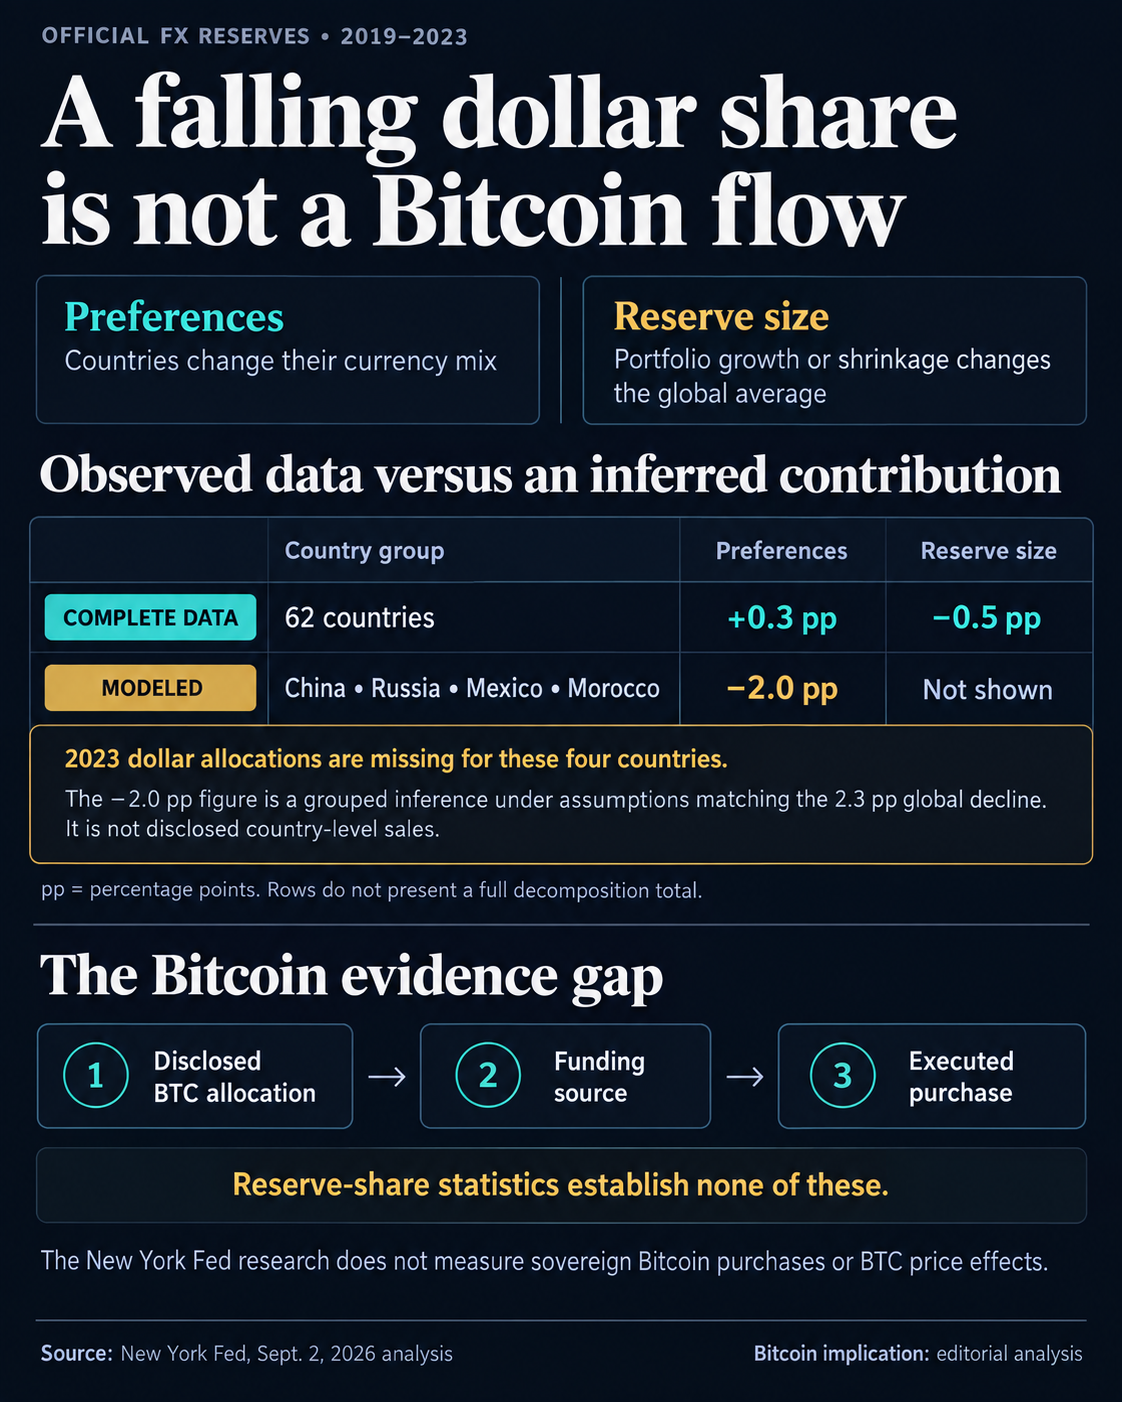
A Sept. 2, 2026 analysis by New York Fed researchers shows how a few large reserve portfolios can lower the global dollar share without a broad retreat from dollars. For investors assessing future sovereign demand for Bitcoin, the distinction is between a changing average and an investment decision.
Linda S. Goldberg, Oliver Hannaoui and Sneha Parthasarathy report that the dollar share of global official foreign-exchange reserves fell from 64% at year-end 2015 to 56% at year-end 2025, using IMF COFER data.
Their country-level evidence points to concentrated decisions and changes in reserve sizes.
Countries can change the currency mix of their portfolios, the “preferences” channel. Alternatively, their total reserves can grow or shrink, changing their weight in the global average.
When a country with a below-average dollar allocation accumulates reserves, it can pull down the worldwide dollar share without cutting its own allocation. Switzerland did that between 2015 and 2019: its reserve growth pushed the aggregate share down even as its own dollar allocation rose.
For that period, 76 countries had complete endpoint data within a 79-country exercise. Their preferences and reserve-size contributions declined by 1.2 and 1.5 percentage points, respectively.
For 2019-2023, the 62 countries with complete data contributed a positive 0.3 percentage point through preferences and a negative 0.5 percentage point through reserve-size changes.
China, Russia, Mexico and Morocco lacked 2023 dollar-allocation data. Under assumptions matching the observed 2.3-percentage-point global decline, the researchers inferred a combined negative 2.0-percentage-point preferences contribution for that group.

A Bitcoin allocation needs its own evidence
The underlying Staff Report 1087, issued in March 2024 and revised in February 2026, separates reserves needed for liquidity from an investment portion above those needs. Trade payments, foreign-currency debt, and currency stabilization sustain the need for liquid reserves.
The paper models that investment portion using short-term external debt or three months of imports as alternative measures of liquidity needs.
Diversification is more prevalent when reserves can satisfy those needs. Its earlier decomposition covers 2015-2020, while its broader country panel spans 1999–2023.
Related Reading
Arthur Hayes calls EUR/JPY prices crypto’s smoke alarm, but the Fed’s plumbing still shows no fire
The distinction also applies when a central bank actually buys Bitcoin. On Nov. 13, 2025, the Czech National Bank announced a $1 million digital-asset test portfolio including Bitcoin, with a dollar stablecoin and tokenized deposit also part of the project.
The amount covered the whole portfolio, and the purchase was explicitly outside international reserves.
Applied to Bitcoin, the reserve research supports a limited inference: diversification beyond liquidity needs does not identify the money’s destination. Neither New York Fed source measures sovereign Bitcoin purchases or estimates a Bitcoin price effect.
A sovereign Bitcoin demand case needs separate evidence: a disclosed allocation, its funding source, and executed purchases, with official reserves distinguished from holdings outside them. A shrinking dollar share supplies none of those details.
Gen Z traders on Binance are allocating a growing share of their equity activity to exchange-traded funds (ETFs), with the products accounting for 25% of the cohort’s trading volume in early August, according to Binance Research.
ETFs accounted for 21.9% of Gen Z net equity inflows in July, up from 18.5% in June, while the share going to individual stocks fell to 74.2% from 77%.
The analysis examined activity across direct equities, tokenized stocks and traditional finance perpetuals, comparing Gen Z accounts with Millennials, Gen X and Baby Boomers on measures including trading frequency, net flows and leverage use.
The younger cohort traded less frequently than other working-age generations across all three products. Gen Z averaged 13 monthly trades in TradFi perpetuals, compared with 17 for Millennials and 16.5 for Gen X.
Among Gen Z direct-equity accounts, 22% had never placed a sell order, compared with 19% of Gen X accounts and 9% of Baby Boomer accounts. Millennials had the highest share of buy-only accounts at 30%. Among those Gen Z buy-only accounts, top assets by cumulative purchases included Broadcom, Tesla and the Schwab US Dividend Equity ETF, according to Binance.
Net buyers by generation and product. Source: Binance
Gen Z also showed relatively little appetite for leveraged and inverse ETFs; 88.2% of Gen Z TradFi perpetual accounts recorded no activity in those products, compared with 84.5% of Millennials and 85.9% of Gen X.
Binance cautioned that its direct-equities product only reached meaningful scale in June, leaving a relatively short data window for establishing longer-term trends.
Related: Binance to restrict transactions involving HTX, 10 other crypto platforms
Binance bStocks briefly overtakes xStocks
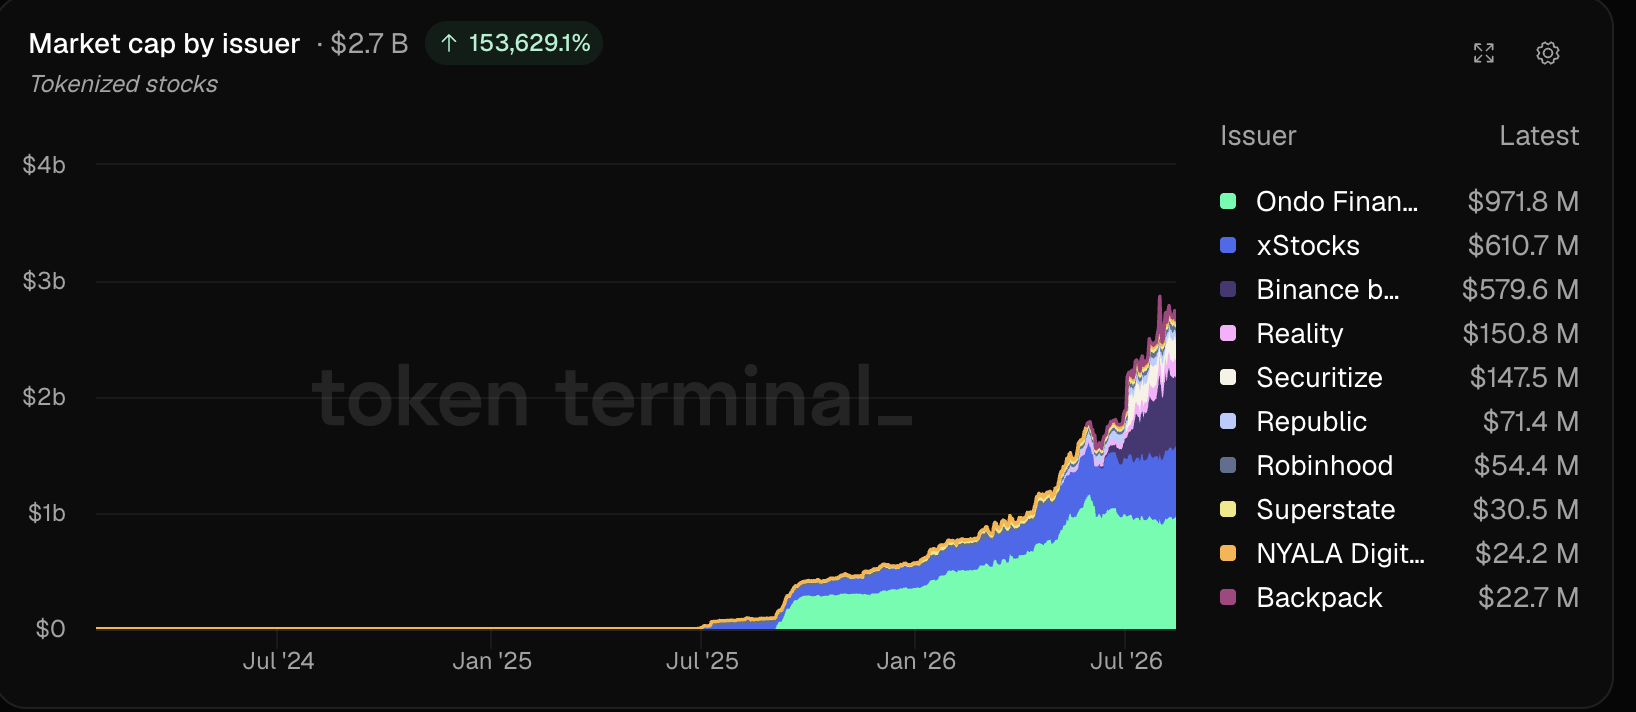
Binance’s bStocks briefly overtook Kraken’s xStocks as the second-largest tokenized stock issuer this week, less than two months after launching. As of Tuesday, bStocks held $610.6 million in tokenized stock value, compared with $601.2 million for xStocks, according to Token Terminal data.
The positions had reversed by Friday, with Token Terminal showing xStocks at $610.7 million and bStocks at $579.6 million, representing 22.3% and 21.2% of the roughly $2.7 billion market, respectively. Ondo Finance remained the largest issuer at $971.8 million.
The broader tokenized stock market has continued to expand, with RWA.xyz tracking $2.43 billion in distributed value as of Friday, up about 5% over the past 30 days.

Tokenized stock market cap by issuer. Source: Token Terminal
Magazine: Solana’s fee overhaul increases burn and makes resource hogs pay
Bitmine Immersion Technologies Announces Cash Dividend Of $0.1056 Per Share Of 9.50% Series A Perpetual Preferred Stock
NORWALK, Conn., June 19, 2026 /PRNewswire/ — (NYSE: BMNR; BMNP) Bitmine Immersion Technologies, Inc. (“Bitmine” or the “Company“) announced today that its Board of Directors has declared a cash dividend of $0.1056 on the Company’s 9.50% Series A Perpetual Preferred Stock (the “Series A Preferred Stock“), which is listed on the New York Stock Exchange under the trading symbol “BMNP”.
The dividend will be payable in cash in accordance with the terms of the Certificate of Designations governing the Series A Preferred Stock. The dividend will be paid on July 10, 2026 to holders of record of the Series A Preferred Stock as of the close of business on June 30, 2026.
About Bitmine
Bitmine (NYSE: BMNR) is a Bitcoin miner with operations in the US. The company is deploying its excess capital to be the leading Ethereum Treasury company in the world, implementing an innovative digital asset strategy for institutional investors and public market participants. Guided by its philosophy of “the alchemy of 5%,” the Company is committed to ETH as its primary treasury reserve asset, leveraging native protocol-level activities including staking and decentralized finance mechanisms. The Company launched MAVAN (Made-in America VAlidator Network), a dedicated staking infrastructure for Bitmine assets, in 2026.
For additional details, follow on X:
Forward-Looking Statements
This press release contains statements that constitute “forward-looking statements” within the meaning of the Private Securities Litigation Reform Act of 1995. The statements in this press release that are not purely historical are forward-looking statements which involve risks and uncertainties. These forward-looking statements can be identified by terms such as “expects,” “projects,” “projected,” “intends,” “believes,” “anticipates,” “estimates,” and similar expressions. This document specifically contains forward-looking statements regarding the Company’s dividend payments on the Series A Preferred. In evaluating these forward-looking statements, you should consider various factors, including: Bitmine’s ability to finance its current business, Ethereum treasury operations, and proposed future business; market conditions affecting the trading price of the Company’s common stock and Series A Preferred Stock; regulatory developments affecting digital assets, including the ultimate enactment and implementation of pending legislation and SEC initiatives; the volatility and unpredictability of digital asset prices; the performance, reliability, and security of the Company’s staking operations; and the future value of Bitcoin and Ethereum. Actual future performance outcomes and results may differ materially from those expressed in forward-looking statements. Forward-looking statements are subject to numerous conditions, many of which are beyond Bitmine’s control, including those set forth in the Risk Factors section of Bitmine’s Form 10-K filed with the SEC on November 21, 2025, as well as all other SEC filings, as amended or updated from time to time. Copies of Bitmine’s filings with the SEC are available on the SEC’s website at www.sec.gov. Bitmine undertakes no obligation to update these statements for revisions or changes after the date of this release, except as required by law.
Ethereum and Solana just crossed a pretty big milestone. Combined DEX volumes on both chains are pushing $45 billion, and the gap between them keeps shrinking.
A year back, Ethereum had a clear lead in decentralized exchange activity. Not anymore. Solana’s been eating into that advantage fast, and recent data shows the two networks running almost neck-and-neck in trading volume. The shift didn’t happen overnight, but it’s been steady enough that traders and developers are taking notice. Solana’s low fees and quick transaction times are pulling users who got tired of paying high gas costs on Ethereum. And those users aren’t just window shopping—they’re moving real volume.
Why Solana’s Gaining Ground
Speed matters. So does cost.
Solana processes transactions in seconds, and fees usually stay under a penny. Compare that to Ethereum, where a simple swap can cost anywhere from a few bucks to over twenty during network congestion. That price gap adds up fast for active traders, especially the ones making multiple trades daily. Solana’s tech stack handles thousands of transactions per second without breaking a sweat, which makes it attractive for high-frequency trading and bot activity. Ethereum’s still got the bigger ecosystem—more protocols, more liquidity pools, more developer tools. But Solana’s catching up in areas that matter most to everyday users.
The numbers back this up. DEX volume on Solana surged over the past year while Ethereum’s growth stayed more or less flat. That doesn’t mean Ethereum’s losing users in absolute terms. It means Solana’s growing faster, pulling in fresh capital and new traders who might’ve defaulted to Ethereum in the past. The competition’s forcing both networks to step up their game.
What This Means for Traders
Market participants are watching closely. The near-parity in DEX volumes between ETH and SOL creates interesting dynamics for liquidity and price discovery. When two major chains compete this hard, it usually means better execution for users—tighter spreads, deeper order books, more protocol options. But it also fragments liquidity, which can be a problem during volatile market conditions.
Some protocols are hedging their bets by deploying on both chains. That way they capture users regardless of which network they prefer. Others are picking sides, betting that one chain will eventually pull ahead and dominate. Neither approach is obviously right or wrong yet. The market’s still figuring out whether this will be a winner-take-all situation or if both networks can coexist long-term with roughly equal market share.
See also: Bitmine Stops Buying ETH After Stacking 26,659 Tokens, Leaving Market Guessing
Ethereum’s got advantages Solana can’t easily replicate. The developer community is massive, battle-tested, and deeply integrated into the broader DeFi ecosystem. Most institutional players still default to Ethereum for serious capital deployment. The network’s been around longer, survived more stress tests, and has a track record Solana can’t match yet. Those things matter when you’re moving serious money.
But Solana’s not standing still. The network’s been stable for months after earlier outages that spooked some users. Performance keeps improving, and the ecosystem’s adding new protocols and features at a rapid clip. Developers who cut their teeth on Ethereum are now building Solana-native projects, bringing expertise and best practices from one chain to the other.
The $45 billion combined volume milestone isn’t just a vanity metric. It shows both chains are handling real economic activity at scale. That volume represents actual trades, actual users, actual value being exchanged on-chain. And it’s growing. Monthly DEX volumes across crypto have been trending up, with Ethereum and Solana capturing the lion’s share of that growth.
Neither network has said much publicly about their strategies going forward. No big announcements, no roadmap updates tied specifically to this DEX volume race. Both are probably focused on the same things they’ve always been focused on—scaling, improving user experience, attracting developers. But the competitive pressure is real, and it’s probably influencing decisions behind the scenes.
More context: ETH Could Hit $22,000 If Bitcoin Reaches $250K and AI Adoption Explodes, Says Tom Lee
One wildcard is Ethereum’s Layer 2 solutions. Networks like Arbitrum and Optimism are siphoning off some DEX volume from Ethereum mainnet, offering faster and cheaper transactions while still settling to Ethereum eventually. That complicates the picture, because it’s not clear whether L2 volume should count as “Ethereum volume” or not. Different analysts measure it differently, which makes apples-to-apples comparisons tricky.
Solana doesn’t have the same L2 dynamic. It’s designed to handle everything on the base layer, which is simpler from an architectural standpoint but also means all the scaling pressure falls on the main chain. So far that’s worked out fine, but it remains to be seen how Solana performs if volumes double or triple from current levels.
The coming months will probably decide whether this near-parity holds or if one chain starts pulling ahead again. User behavior can shift fast in crypto, and a major protocol launch or network upgrade on either side could tip the balance. Both Ethereum and Solana are positioned to capture more market share if they play their cards right.
Post Views: 1
Frequently Asked Questions
What are the current DEX volumes for Ethereum and Solana combined?
The combined decentralized exchange volumes for Ethereum and Solana are approaching $45 billion, with the gap between the two networks narrowing significantly over the past year.
Why is Solana gaining market share against Ethereum in DEX activity?
Solana’s rapid transaction speeds and significantly lower fees—often under a penny per transaction—are attracting traders who want to avoid Ethereum’s higher gas costs, especially for frequent trading.
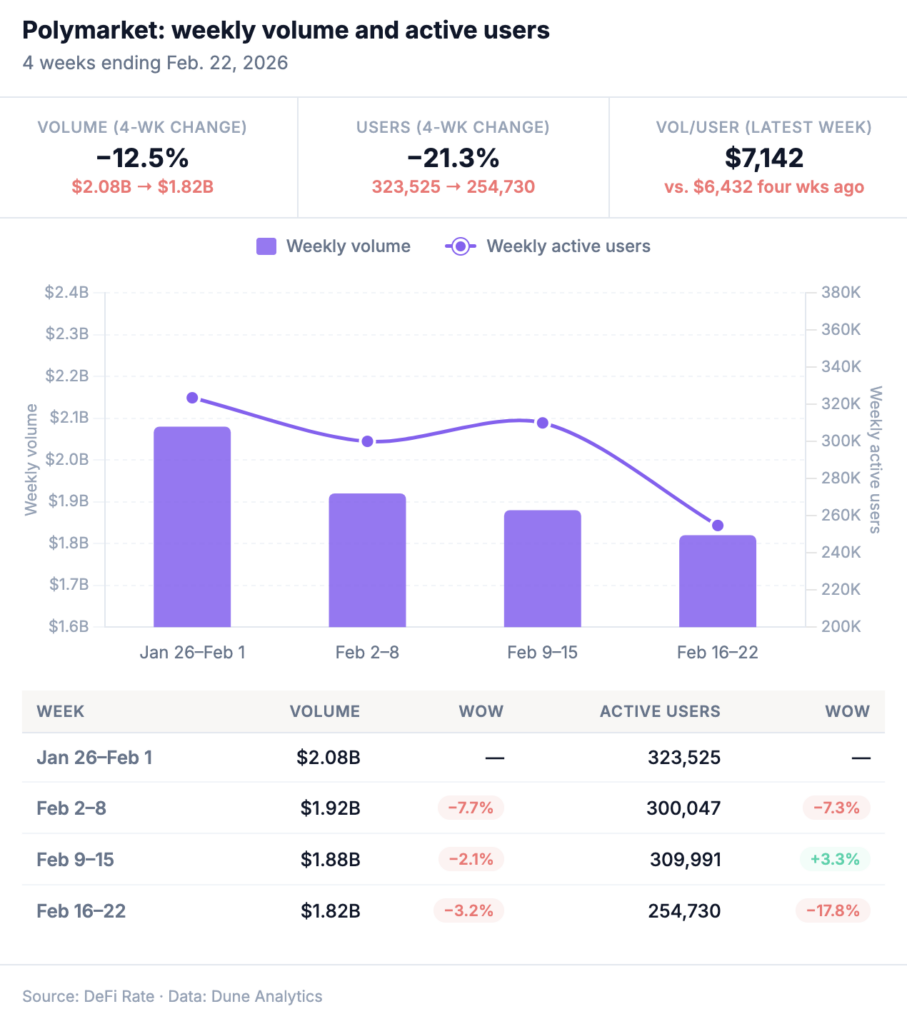
Weekly notional volume across prediction market platforms dipped 1.4% to $5.25 billion for Feb. 16–22. Kalshi jumped 6.7% to $2.59 billion as Polymarket slid 3.2% WoW to $1.83 billion.
Prediction markets appear to be consolidating, posting $5.25 billion across all tracked platforms for the week ending Feb. 22. The weekly volume was essentially flat against the $5.33 billion posted the prior week, and it marks the second consecutive week without a meaningful swing in either direction after the Super Bowl unwind.
But a top-line that barely moves can still tell a story, and the internals this week are more interesting than the surface suggests. Kalshi’s volume jumped 6.7% week-over-week, pushing its market share from 45.5% to 49.3% as Polymarket’s share stayed relatively flat at 34.6%. Opinion logged a third straight week of double-digit percentage declines. And on the user side, Polymarket’s active base dropped nearly 18% even as the platform’s transaction count climbed.
According to DeFi Rate’s prediction market tracker, Kalshi and Polymarket combined for $4.41 billion this week — up from $4.31 billion the week prior as the main prediction market duo reinforces its baseline without NFL or another major trading catalyst.
Platform breakdown: Week of Feb. 16-22
The full week-over-week comparison for the weeks ending Feb. 15 and Feb. 22 continue the trend of platforms outside of Kalshi and Polymarket showing more volatility from one week to the next. Meanwhile, Kalshi’s $2.59 billion and Polymarket’s $1.83 billion weekly trading volume fall within expected ranges.
| Platform | Feb 9–15 | Feb 16–22 | WoW change | Mkt share (2/16–22) |
|---|---|---|---|---|
| Kalshi | $2.43B | $2.59B | +6.7% | 49.3% |
| Polymarket | $1.88B | $1.82B | −3.2% | 34.6% |
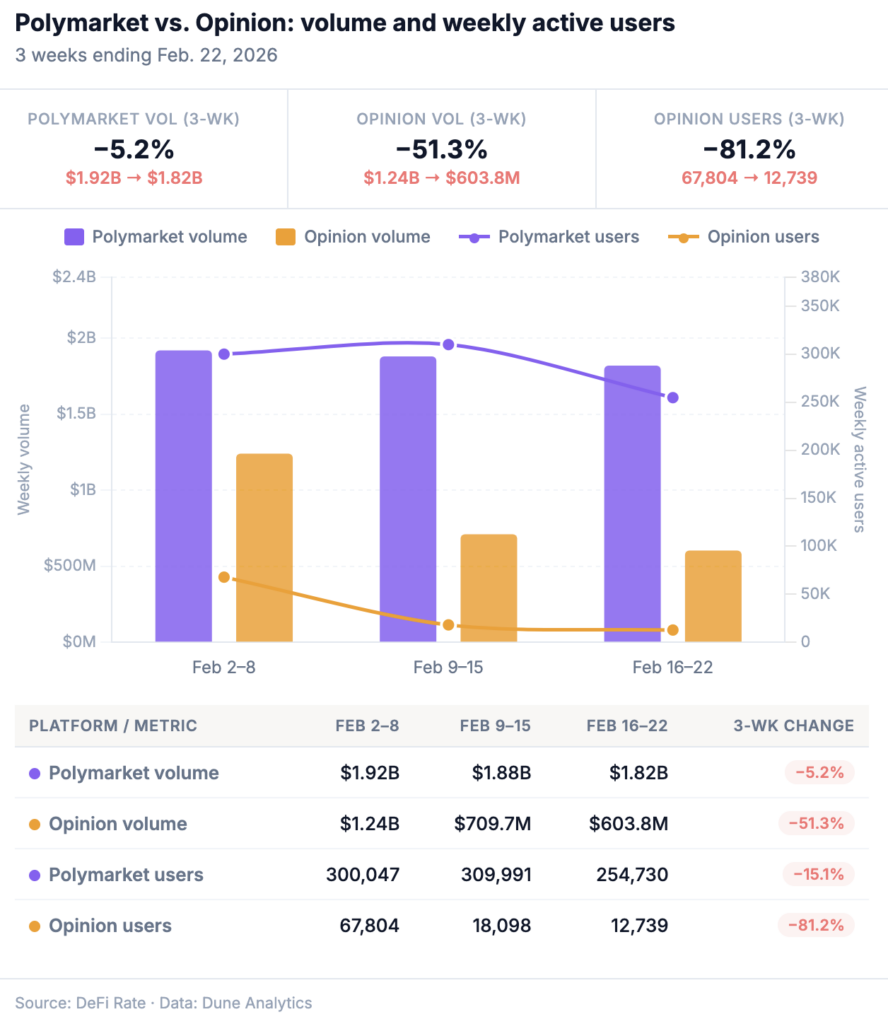
| Opinion | $709.7M | $603.8M | −14.9% | 11.5% |
| predict.fun | $184.7M | $220.3M | +19.3% | 4.2% |
| Other* | $126.4M | $12.6M | — | 0.2% |
| Overtime.io | $3.9M | $4.5M | +14.4% | 0.1% |
| Total | $5.33B | $5.25B | −1.4% | 100% |
*”Other” on the Dune dashboard groups Limitless, Myriad, and ForecastEx for UX reasons, as noted by Dune. The prior week tracked Limitless ($109.4M) and Myriad ($17.0M) as separate line items. The sharp apparent decline in “Other” reflects this grouping change rather than a volume collapse at those platforms. Whether Limitless maintained its +58.7% gain from the prior week is not determinable from current data.
The week reinforced the two-tier structure of the market. Kalshi and Polymarket together accounted for 83.9% of all tracked volume, up from 80.8% the prior week. That concentration has ticked upward for three consecutive weeks, as Opinion contracts and the smaller platforms remain too small to meaningfully offset the shift.
Kalshi sustains trading volume post-Super Bowl
Kalshi’s $2.59 billion in weekly volume during the second week after the Super Bowl is not what you’d expect from a platform whose top volume driver just went dark. Kalshi was up 6.7% WoW, its second consecutive positive week, and crossed 49% market share for the first time in the current reporting period.
Looking at the past six weeks of notional volume data, Kalshi is settling in as consistent market leader with Polymarket a clear No. 2, with sports volume the main differentiator as we’ve already established.
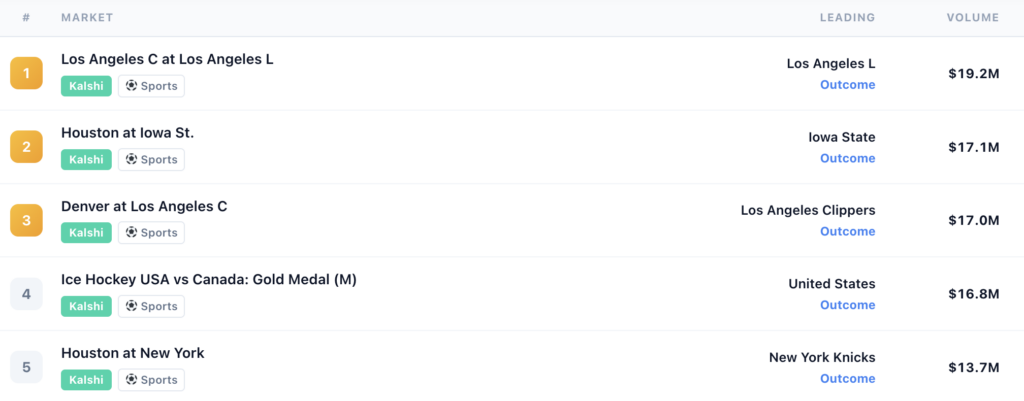
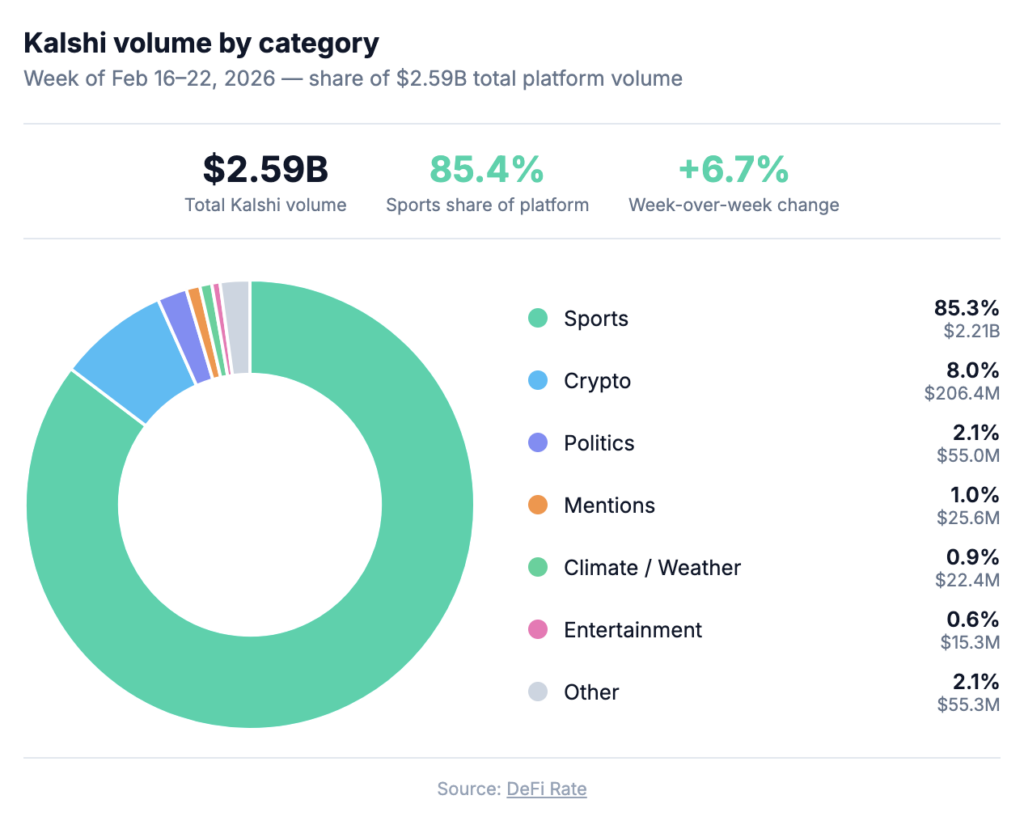
The category breakdown explains what’s filling the post-NFL gap. Sports volume came in at $2.21 billion, up from $1.996 billion the prior week: a 10.9% increase without any football on the schedule. The main drivers include NBA, NCAAB and some Olympic events, notably the USA-Canada hockey final. The NBA regular season resumed Thursday after the All-Star break, with conference standings tightening as the playoff picture comes into focus, and college basketball markets deepening as Selection Sunday (March 15) moves into view.
Neither the NBA nor the NCAA tournament individually matches the Super Bowl as a single-event volume catalyst, but together they represent weeks of sustained, high-engagement trading rather than a one-day spike. Kalshi’s sports concentration deepened again this week, from 82.2% to 85.4% of total platform volume. The platform is not diversifying away from sports, though politics will likely grow in category share as we get closer to the midterms. Here are Kalshi’s top five volume markets for the trailing seven days, according to our tracking.

The non-sports categories, while growing in isolation, still pale in comparison to the sports engine. Crypto was the second-largest category at $206.4M (8.0% of platform volume), followed by politics at $55.0M (2.1%) and mentions at $25.6M (1.0%). Climate and weather showed up meaningfully at $22.4M, and entertainment dropped to $15.3M — down from $22.7M the prior week, continuing the post-Super Bowl normalization.

Interesting to note that Kalshi’s crypto category has now grown in each of the past two weeks (+22% last week, +8.3% this week). Economics and financials are present but thin. The non-sports diversification is real, but at 14.6% of total volume, it’s still a footnote to the sports story. Vitalik Buterin‘s concerns, which we covered last week, that prediction markets are over-converging toward sports and short-term crypto speculation at the expense of durable financial utility is not getting any less relevant as you watch these category splits week by week.
Polymarket: Resilient on volume as weekly users decline
Polymarket held up reasonably well this week on volume — down 3.2% to $1.82 billion — but the user number that came back from Dune is hard to ignore. Polymarket’s 254,730 weekly active users was down from 309,991 the prior week, representing a drop of nearly 18% in one week.

That’s a significant user pullback on a smaller volume dip. The data raises some questions: Polymarket processed 22.7 million transactions last week with 17.8% fewer users, meaning the remaining base traded more frequently and likely in larger average trade sizes. Whether that’s healthy consolidation around engaged power users or early-stage retail churn remains to be seen in the coming weeks.
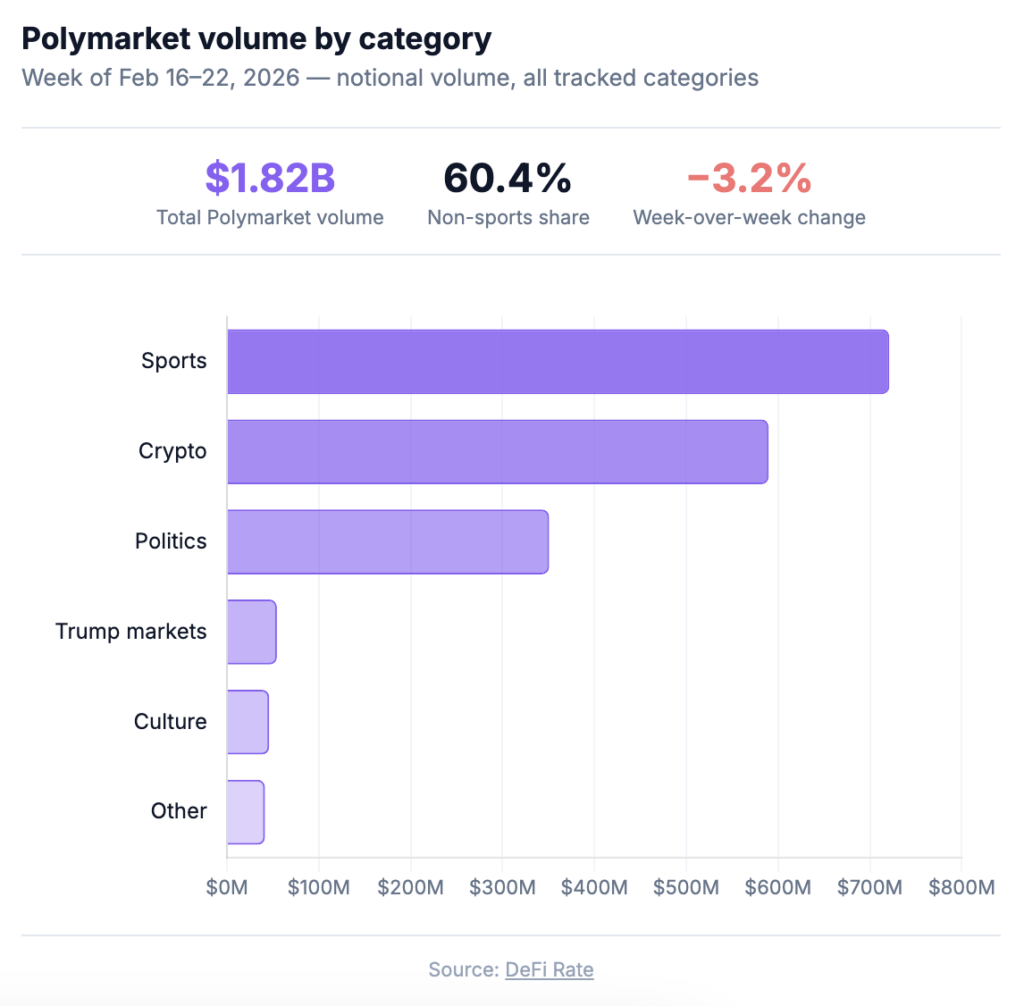
Meanwhile, the category split continues to differentiate Polymarket from Kalshi in significant ways. Sports remained the top category at $721.2M (39.6% of platform volume), but crypto and politics together contributed another $940.6M, with Trump-specific markets tracked as a discrete category at $54.4M. Polymarket’s top three categories span genuinely different domains and different user motivations, which serves as a structural buffer when any single category cools.

A few category moves worth noting. Culture jumped to $46.0M, nearly doubling from last week’s $25.3M. Economy showed up as a discrete category at $24.2M as earnings trading fell sharply to $391K from last week’s $5.4M. The cross-platform convergence on the March Fed decision is also worth flagging: both Kalshi (96%) and Polymarket (96%) are pricing no rate cut at the March meeting, a near-identical read on a macro event across independently operated markets, consistent with CME FedWatch pricing above 97% hold probability. It’s a clear illustration of what the Fed study we covered last week was pointing at.
The more notable Polymarket news this week didn’t come from the volume data. The platform launched a public API and permissionless liquidity infrastructure, a structural shift DeFi Rate covered separately. The long-term read on that move: Polymarket US is building toward a market-maker ecosystem and programmatic trading that could change who generates volume on the platform and how. The user count may matter less if institutional and API-driven flow scales.
Kalshi vs. Polymarket: The split deepens
The sports vs. non-sports divide between these two platforms has been a recurring theme in our weekly coverage, and this week sharpened it further.
| Segment | Kalshi | Polymarket | Total |
|---|---|---|---|
| Sports | $2.21B (85.4% of Kalshi) | $721.2M (39.6% of Poly) | $2.93B |
| Non-sports | $377.6M (14.6%) | $1.10B (60.4%) | $1.48B |
In sports markets, Kalshi’s 3:1 lead from last week widened slightly. In non-sports, Polymarket’s lead held near the same ratio. Two platforms at roughly similar overall scale continue to serve fundamentally different but overlapping market functions.
The divergence is intentional on both sides. Kalshi’s Giannis partnership and Robinhood distribution infrastructure are explicitly sports-facing. Polymarket’s API buildout and deep crypto/politics liquidity are explicitly not. The question that will define the next six months isn’t which model wins as both are clearly working, but which model is better insulated when the sports calendar thins out.
Opinion’s decline continues
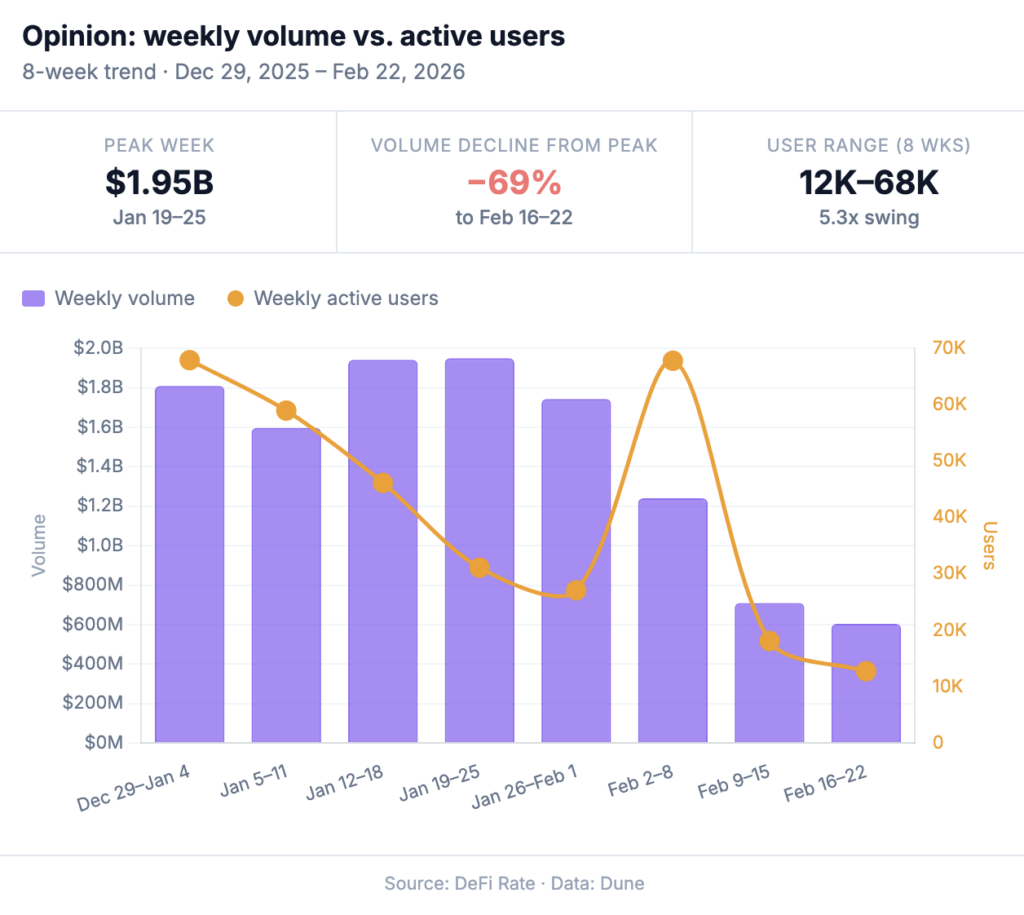
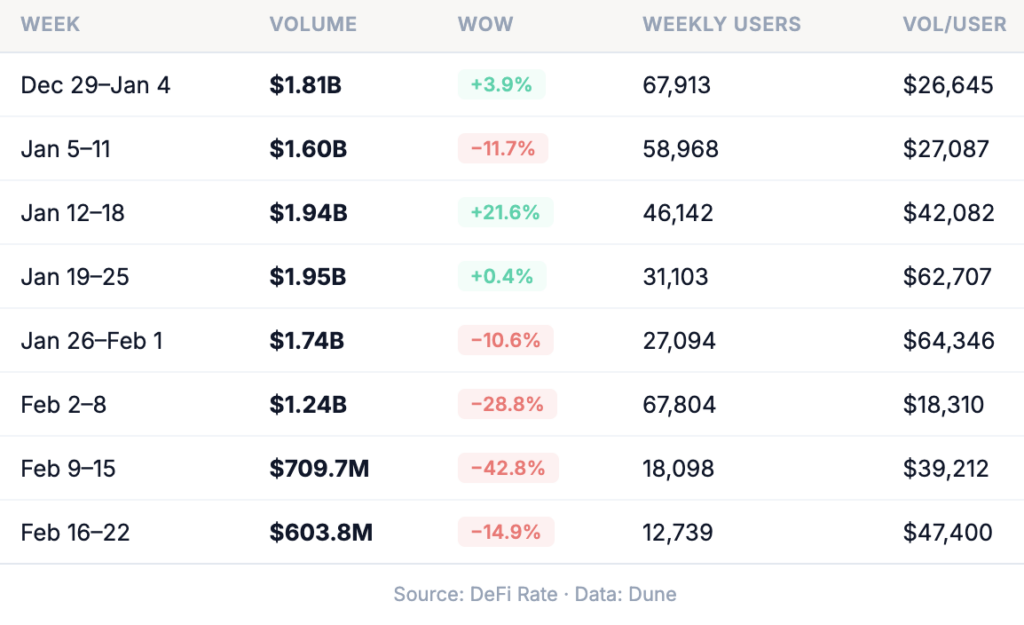
Opinion logged a third straight week of meaningful volume decline coming in at $603.8M, down 14.9% from $709.7M. The platform has now shed 63.6% of its volume since its Jan. 19 peak of $1.95 billion across four consecutive down weeks.
We published a deep dive on Opinion’s data this week, and the new weekly data reinforces that analysis. The platform’s user count fell to 12,739, down 29.6% from 18,098 the prior week. Its per-user volume figure climbed again: at $603.8M across 12,739 users, that’s roughly $47,400 per user per week, up from ~$39,200 the week before. The user base is contracting faster than the volume, which means the remaining traders are becoming even more concentrated.

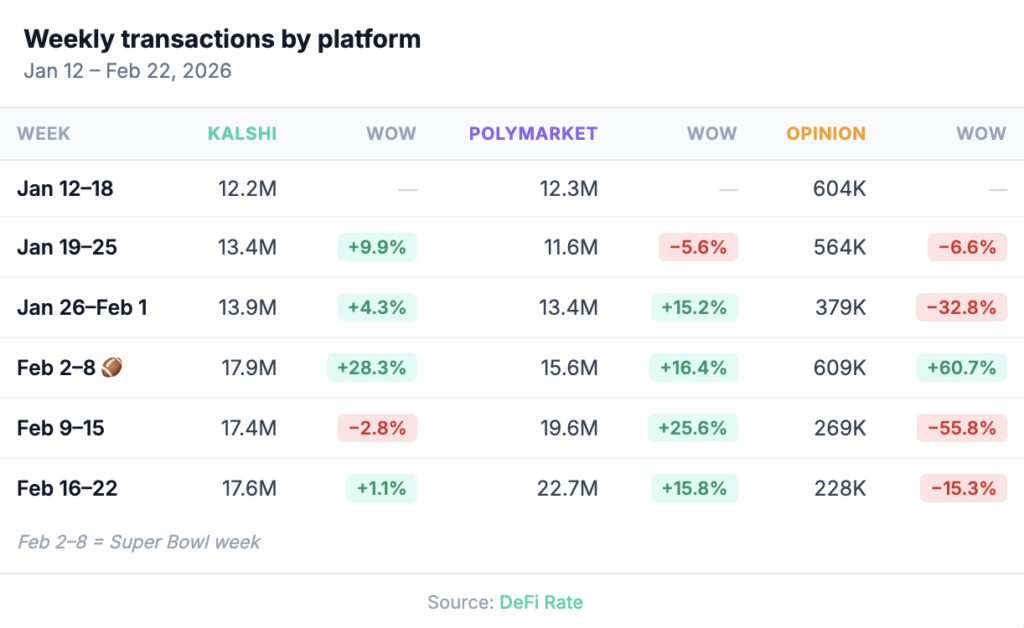
The transaction count offers further context. Opinion processed 227,847 transactions this week, generating $603.8M in volume, an implied average trade size of approximately $2,650 per transaction. Polymarket’s 22.7 million transactions generated $1.82 billion, for an average of roughly $80 per transaction. The gap, now approximately 33:1, has not narrowed meaningfully through Opinion’s growth or its subsequent decline. And it continues to point to inflated, artificial trading volumes as we noted in our separate Opinion platform analysis.


Opinion remains the third-largest exchange in tracked volume by a wide margin. It has real infrastructure, credible backers in Hack VC and Jump Crypto, and market categories that fill genuine gaps for non-US traders outside the Kalshi/Polymarket duopoly. But the structural questions documented in our deep dive haven’t resolved themselves. Until the platform’s volume-to-transaction ratio converges toward industry norms, or an independent analysis of BNB Chain activity addresses the wash trading question, Opinion’s headline figures warrant the same careful reading they always have.
Transactions and users: The full picture
The transaction count divergence between Polymarket and Opinion this week is stark. Polymarket processed 22.7 million transactions — 100x more than Opinion’s 227,847 — while generating roughly 3x the volume.

Kalshi’s 17.6 million transactions were nearly neck and neck with Polymarket’s, reflecting the platform’s high-frequency sports trading infrastructure. Together, Kalshi and Polymarket accounted for 98.2% of all tracked transactions this week.
The 20.3% drop in total tracked users (excluding Kalshi), from 362,704 to 289,144 is the week’s most notable macro signal on the demand side. Whether this is post-Super Bowl seasonality running through the system or something more structural will be clearer in the coming weeks. Retail user attrition after peak event cycles is a known pattern in sports betting; the question for prediction markets is how deep the drop-off goes before the next catalyst, which is coming up in March.
What comes next?
The sports calendar is about to get busy again. The NBA resumed Thursday after the All-Star break, and Selection Sunday is March 15 — just three weeks out. Once the bracket drops, March Madness becomes Kalshi’s biggest volume event outside the NFL season (at least until major elections). Last year’s Robinhood partnership drove over $200 million in tournament volume. With a broader distribution footprint and a year of platform maturity, that ceiling is much higher now. The next four weeks are the real test of whether Kalshi’s post-Super Bowl floor holds: if the $2.4–2.6B weekly run rate sustains through mid-March, it suggests the retail base is genuinely sticky and not purely event-driven.
For Polymarket, the API launch and permissionless liquidity infrastructure matter more than any single week’s numbers. If programmatic trading and market-maker participation scale, volume generation may decouple from user count in ways the weekly active user metric doesn’t yet capture.
Opinion’s trajectory remains an open question. Three consecutive weeks of double-digit decline following four weeks of prior losses is a sustained contraction from the January peak. Whether it stabilizes, continues toward the $400–500M range, or reverses depends largely on the $OPN token timeline and what that does to points farming incentives — neither of which is visible in the current data.
The macro picture hasn’t changed: an industry that grew 13x in six months doesn’t need to panic over a few flat weeks. But as the Super Bowl cycle fully clears, the next month will tell us what this market actually looks like without the NFL underneath it.
Data sourced from DeFi Rate’s prediction market tracker and Dune Data Dashboards. Weekly data reflects the calendar week of Feb. 16-22 unless otherwise noted. Note: For UX reasons, projects including Limitless, Myriad, and ForecastEx are grouped together under “Other” on the Dune dashboard.
Valerie Cross
Valerie Cross is a reporter, editor, and prediction markets analyst with more than a decade of experience covering legal gaming and emerging financial markets. She joined DeFi Rate in 2026 after reporting on the rise of mainstream prediction markets and previously held senior editorial roles at Prediction News and Catena Media. Valerie holds a BA from Furman University and MA and PhD degrees from Indiana University.
Drone Data Services Market to Reach US$ 24.58B by 2032 | CAGR 33.34% | North America Leads with 38% Share | Key Players: 4DMapper, Agribotix, DJI, Delair-Tech SAS, Hexcel Corporation, Pyrotek Inc., SABIC, Teijin Ltd.
Drone Data Services
Market Overview
The global Drone Data Services Market reached US$ 2.46 billion in 2024 and is projected to reach US$ 24.58 billion by 2032, growing at an impressive CAGR of 33.34% during the forecast period (2025-2032). Drone data services leverage unmanned aerial vehicles (UAVs) equipped with high-resolution cameras, sensors, and LiDAR systems to collect, process, and analyze aerial data. These services enhance operational efficiency, reduce project costs, and improve accuracy in critical decision-making across industries such as agriculture, construction, mining, energy, logistics, and environmental monitoring. By enabling real-time data acquisition and 3D mapping, drone data solutions are becoming integral to precision-driven industries seeking enhanced visibility and resource optimization.
Get a Free Sample PDF Of This Report (Get Higher Priority for Corporate Email ID):-https://www.datamintelligence.com/download-sample/drone-data-services-market?juli
Market expansion is fueled by the growing need for accurate, efficient, and scalable data collection solutions, especially in sectors embracing digital transformation and automation. For example, in agriculture, drones are increasingly used for precision farming, monitoring crop health, irrigation patterns, and yield estimation. In the construction sector, drones streamline project planning, surveying, and progress tracking, while in logistics and energy, they enable asset inspection and infrastructure management.
Regulatory advancements such as Federal Aviation Administration (FAA) frameworks in the United States and European Union Aviation Safety Agency (EASA) rules have also played a pivotal role in expanding commercial drone operations. By providing structured operational guidelines and safety protocols, these frameworks have increased enterprise confidence and accelerated large-scale adoption of drone-based data solutions globally.
Recent Developments:
✅ January 2026 – United States: A leading drone analytics provider launched an AI-enhanced data processing platform that integrates real-time aerial imagery with predictive insights for construction progress and safety monitoring.
✅ November 2025 – Europe: A major drone services company unveiled a cloud-based data management suite for agriculture and infrastructure sectors, enabling cross-platform integration with GIS and farm-management systems.
✅ September 2025 – Japan: A tech consortium implemented autonomous flight scheduling and automated data capture services for energy grid inspections, reducing manual intervention and improving asset reliability.
✅In February 2024, Skyports Drone Services (Skyports) and Ground Control have announced a new drone survey and AI data capture service with Network Rail. By collecting important environmental data like vegetation growth, tree health and type, the service helps UK railway infrastructure owners make informed decisions about vegetation management.
Mergers & Acquisitions:
✅ January 2026 – United States: A leading drone data analytics company acquired a U.S.-based aerial intelligence platform provider to expand its turnkey services in construction, agriculture, and energy sectors.
✅ October 2025 – Europe: A major European unmanned systems firm completed the acquisition of a drone GIS and mapping services specialist, enhancing its end-to-end data collection and analytics capabilities.
✅ August 2025 – Japan: A regional technology integrator acquired a drone operations and data interpretation startup to strengthen its presence in autonomous inspection services for industrial infrastructure.
Buy Now & Unlock 360° Market Intelligence:-https://www.datamintelligence.com/buy-now-page?report=drone-data-services-market?Juli
Key Players:
4DMapper, Agribotix, DJI, Delair-Tech SAS, Hexcel Corporation, Pyrotek Inc., SABIC, Teijin Ltd., Toray Industries, Inc., and Victrex plc.
Market Segmentation:
By Service:
Mapping and Surveying services dominate the market with a 35% share, driven by strong demand in construction, mining, and agriculture for accurate topographical data and 3D modeling. Inspection and Monitoring account for 25%, primarily used in infrastructure, energy, and utility asset management. Aerial Photography and Videography hold 20%, with rising adoption in real estate, tourism, and media production. Other services-such as data processing, modeling, and consulting-make up the remaining 20%, catering to niche industrial and research applications.
By Platform:
Cloud-based platforms lead the market with a 55% share, as enterprises increasingly prefer scalable and accessible data storage and analytics solutions that enable real-time collaboration. On-premise platforms represent 30%, favored by organizations requiring high data security and control. Hybrid platforms, integrating local processing with cloud-based analytics, hold 15%, offering flexibility and performance optimization for large-scale industrial projects.
By Application:
Construction and Infrastructure hold the largest share at 32%, leveraging drones for surveying, site monitoring, and project progress tracking. Agriculture follows with 25%, where drone data supports precision farming, irrigation analysis, and crop health monitoring. Energy and Utilities contribute 18%, using drones for pipeline, powerline, and wind turbine inspections. Environmental Monitoring and Disaster Management represent 15%, aiding in terrain analysis and post-disaster assessments. The remaining 10% comes from Logistics, Mining, and Real Estate, where drones are deployed for asset mapping and performance analytics.
By End-User:
Commercial enterprises dominate with a 45% share, using drone data services to optimize operations and improve productivity. Government and Defense sectors account for 25%, adopting drones for surveillance, border monitoring, and disaster management. Agriculture and Forestry hold 20%, integrating drones for yield analysis and land resource planning. The remaining 10% is contributed by research institutions and environmental organizations employing drones for scientific data collection and analysis.
Speak to Our Analyst and Get Customization in the report as per your requirements:-https://www.datamintelligence.com/customize/drone-data-services-market?Juli
Regional Insights:
North America:
North America dominates the global drone data services market, accounting for approximately 38% of the total share in 2024. The region’s growth is fueled by early adoption of drone technologies across construction, agriculture, and energy sectors, supported by well-established regulatory frameworks such as the Federal Aviation Administration (FAA) Part 107 regulations. The United States leads the market, with enterprises leveraging drone-based data analytics for infrastructure inspection, precision farming, and logistics monitoring. The presence of leading drone manufacturers and data service providers, coupled with government initiatives promoting unmanned aerial systems (UAS) innovation, continues to drive market expansion across the region.
Europe:
Europe holds around 26% of the global market share, driven by strong growth in infrastructure monitoring, environmental management, and renewable energy projects. Countries like Germany, France, and the United Kingdom are at the forefront of adopting drone data solutions, supported by the European Union Aviation Safety Agency (EASA) regulations that ensure safe and standardized drone operations. The growing focus on smart city initiatives, climate monitoring, and precision agriculture further accelerates adoption.
Asia-Pacific:
Asia-Pacific is the fastest-growing region, with a market share of approximately 25%, propelled by rapid industrialization, urban expansion, and the integration of drone technologies in agriculture and construction. China, Japan, India, and Australia are key contributors. Governments in the region are actively promoting Drone-as-a-Service (DaaS) business models and digital transformation initiatives. For instance, India’s Drone Shakti program and Japan’s urban air mobility initiatives are catalyzing the regional drone ecosystem.
Market Dynamics:
Driver: Cost-Effective and High-Precision Data Collection
The global drone data services market is expanding rapidly due to the increasing need for accurate, efficient, and cost-effective data acquisition across multiple industries such as agriculture, construction, mining, and environmental monitoring. According to the International Civil Aviation Organization (ICAO), drone data services are emerging as a vital component of digital transformation strategies, supporting operational visibility and resource optimization.
Service providers are integrating artificial intelligence (AI) and machine learning (ML) algorithms into their platforms to analyze large datasets in real time, improving accuracy and data interpretation. These innovations enable applications such as precision farming, infrastructure assessment, and resource exploration. The development of high-performance drones equipped with LiDAR, multispectral, and thermal imaging sensors is also enhancing the value proposition of drone data services, particularly in environmental management and disaster response.
Moreover, drones are increasingly capable of operating in challenging environments from high altitudes to extreme weather conditions broadening their use cases. Research published in the Journal of Remote Sensing demonstrated that LiDAR-equipped drones can achieve up to 95% accuracy in terrain mapping, even in dense vegetation. This level of precision and adaptability is becoming indispensable as industries prioritize operational efficiency, environmental safety, and data reliability for strategic decision-making.
Restraint: High Cost of Deployment and Stringent Government Regulations
Despite its rapid adoption, the drone data services market faces challenges related to high deployment costs and regulatory constraints. The cost of acquiring and operating professional-grade drones varies significantly, with commercial units ranging between US$ 10,000 and US$ 50,000, depending on payload capacity and sensor sophistication. Additionally, advanced imaging sensors such as LiDAR and thermal cameras can cost US$ 1,000 to US$ 5,000 each, further elevating operational expenses for service providers and end users.
Regulatory frameworks add another layer of complexity. In the United States, the Federal Aviation Administration (FAA) imposes strict operational and safety requirements, including Remote Pilot certification, airspace authorization, and flight operation limits under Part 107. Compliance often leads to additional administrative and training costs. Similarly, in Europe, the General Data Protection Regulation (GDPR) enforces stringent data handling and privacy standards, affecting how aerial imagery and geospatial data are stored and utilized.
📌 Request for 2 Days FREE Trial Access: https://www.datamintelligence.com/reports-subscription
☛ Power your decisions with real-time competitor tracking, strategic forecasts, and global investment insights all in one place.
✅ Competitive Landscape
✅ Sustainability Impact Analysis
✅ KOL / Stakeholder Insights
✅ Unmet Needs & Positioning, Pricing & Market Access Snapshots
✅ Market Volatility & Emerging Risks Analysis
✅ Quarterly Industry Report Updated
✅ Live Market & Pricing Trends
✅ Import-Export Data Monitoring
☛ Have a look at our Subscription Dashboard: https://www.youtube.com/watch?v=x5oEiqEqTWg?Juli
Contact Us –
Company Name: DataM Intelligence
Contact Person: Sai Kiran
Email: Sai.k@datamintelligence.com
Phone: +1 877 441 4866
Website: https://www.datamintelligence.com
About Us –
DataM Intelligence is a Market Research and Consulting firm that provides end-to-end business solutions to organizations from Research to Consulting. We, at DataM Intelligence, leverage our top trademark trends, insights and developments to emancipate swift and astute solutions to clients like you. We encompass a multitude of syndicate reports and customized reports with a robust methodology.
Our research database features countless statistics and in-depth analyses across a wide range of 6300+ reports in 40+ domains creating business solutions for more than 200+ companies across 50+ countries; catering to the key business research needs that influence the growth trajectory of our vast clientele.
This release was published on openPR.
Web3Wire – Information, news, press releases, events and research articles about Web3, Metaverse, Blockchain, Artificial Intelligence, Cryptocurrencies, Decentralized Finance, NFTs and Gaming.
Visit Web3Wire for Web3 News and Events, Block3Wire for the latest Blockchain news and Meta3Wire to stay updated with Metaverse News.
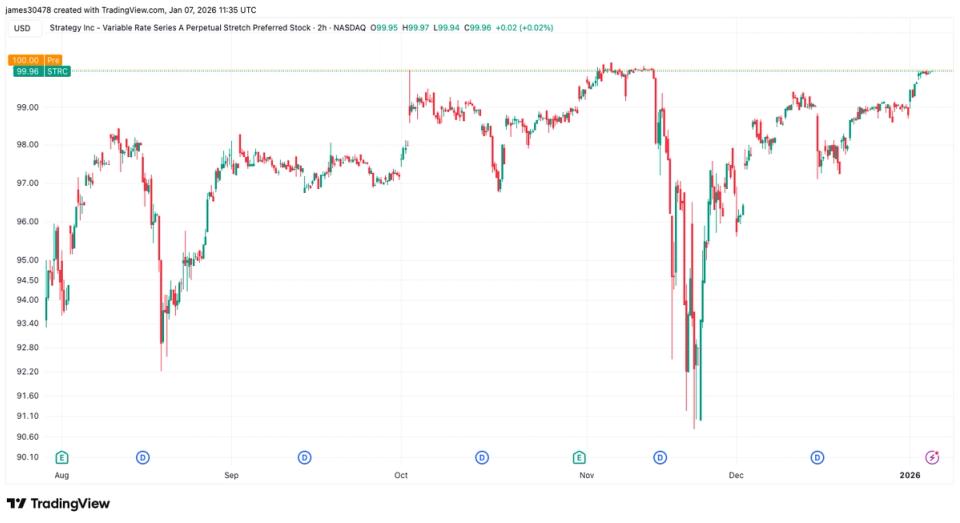
MSTR’s perpetual preferred STRC returns to $100, allowing share issuance to buy more BTC
Stretch (STRC), the perpetual preferred equity issued by Strategy (MSTR), the largest corporate holder of bitcoin BTC
STRC last traded at that level between Nov. 4 and Nov. 13, before falling to a low near $90. The return to par allows Strategy to issue shares through at-the-market (ATM) offerings tied to the product.
The equity is branded as short-duration, high-yield credit. It currently pays an 11% annual dividend, distributed monthly in cash. The dividend rate is reset monthly to encourage trading around the $100 par value and to help reduce price volatility.
Since inception, STRC has risen 16% and offers an effective yield of roughly 11%. The annualized yield is calculated as the current dividend divided by the STRC share price.
MSTR raised the dividend rate on STRC to 11% at the start of the year, marking the fifth dividend increase since the product was introduced in July. The company’s common stock is up 4% in pre market trading to $165, while STRC is up 0.03% at $100.