MSCI’s new non-operating company rules could exclude Strategy, Metaplanet and SharpLink. The final list of affected firms is due Nov. 11.


 Live Chat
MSCI’s new non-operating company rules could exclude Strategy, Metaplanet and SharpLink. The final list of affected firms is due Nov. 11.

The US commodities regulator has warned that prediction market contracts tied to what a person says or does carry a heightened risk of manipulation, putting exchanges on notice as the industry faces increasing scrutiny over market integrity.
The Commodity Futures Trading Commission’s Division of Market Oversight on Tuesday said it issued an advisory to some of its regulated entities, advising that there are only “limited circumstances” in which “mention markets” — event contracts based on whether an individual will say certain words, attend or appear at an event or interact with another person — can be listed consistently with the Commodity Exchange Act.
“These contract types present a heightened risk of manipulation because their settlement turns on the discrete conduct of a person that may be neither independently generated nor externally verifiable,” the regulator said.
The warning follows several cases involving traders accused of exploiting privileged information on prediction markets, including a former White House teleprompter operator who was ordered last month to return $107,539 in profits and pay a $65,000 civil penalty for trading contracts tied to US President Donald Trump’s speeches.
Related: Kalshi US visits soar 1,500% as regulatory pressure mounts
According to CNBC, the CFTC letter said exchanges listing mention markets should consider four factors: whether there are adequate oversight measures in place to detect manipulation, whether the words or actions used for settlement are independently verifiable, external pressure that could influence the subject’s conduct, and what outside obligations the subject of the mention market may have.
CFTC Chair Mike Selig welcomed the guidance in an X post on Tuesday, saying that “regulatory clarity drives sound markets.”
“Pleased to see staff provide guidance on the potential risks and unique considerations associated with the listing of mention markets on CFTC-regulated exchanges and remind DCMs of their obligation to list only contracts not readily susceptible to manipulation.”
Cointelegraph reached out to the CFTC for comment.
The CFTC had reportedly already begun examining mention markets before Tuesday’s advisory.
CNBC and NPR reported in August that the regulator had opened a review into the contracts over manipulation concerns, with Kalshi removing mention markets tied to sporting events “until further notice” as the regulator conducted its inquiry.
Separately, unusual trading activity on Kalshi has drawn fresh scrutiny over potential market manipulation.
In August, nearly one million trades worth more than $5 billion were made in a single market tied to the price of Ether, with more than a third occurring in nearly identical amounts of around $5,500, the Wall Street Journal reported Tuesday.
The activity has caught the attention of federal regulators and traders, according to the Journal, though Kalshi has rejected suggestions that the transactions amounted to wash trading.
Magazine: How to fix suspected insider trading on Polymarket and Kalshi
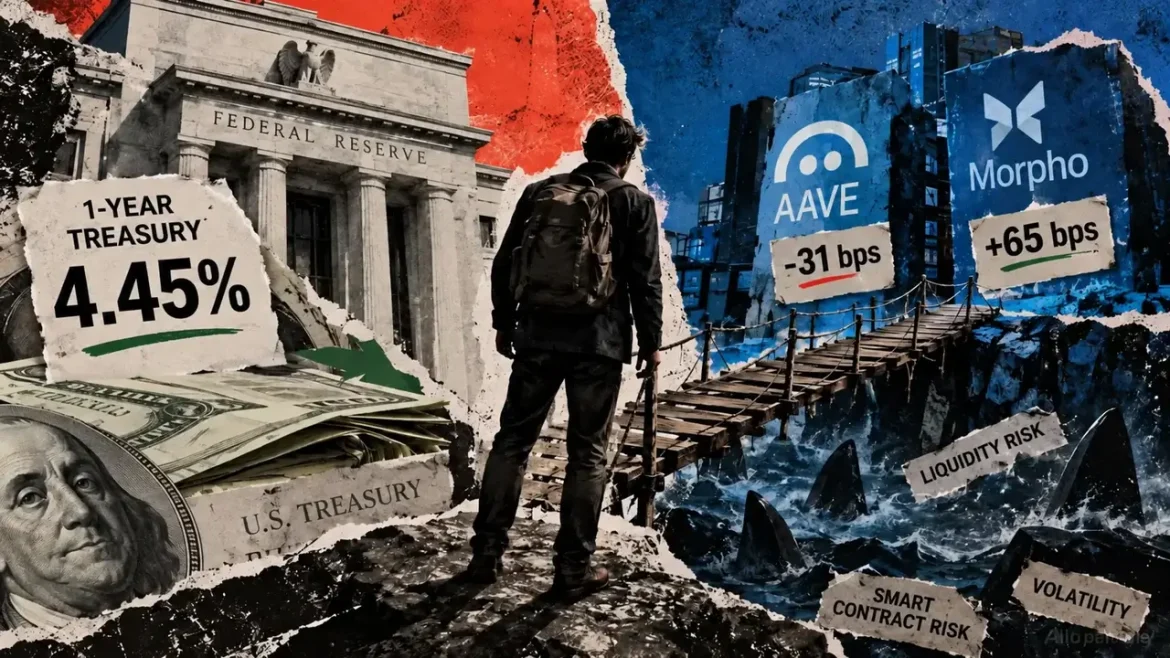
The Federal Reserve raised its target range by 25 basis points to 3.75%-4.00% on Sept. 16, pushing the one-year Treasury yield to 4.45% the same day and pressuring crypto lending yields.
That move lifts the return available to anyone willing to hold nothing riskier than government debt, setting a fresh benchmark for crypto lending yields to measure against.
Coin Metrics found that USDC lenders on Aave earned an average of 31 basis points less than that one-year Treasury throughout the period it studied in 2026. The Aave yield fell short of the Treasury rate in 78% of the intervals measured across that same window.
That gap predates the Fed decision, and the more useful question is what a Fed hike does to the calculation from here.
| Yield / Benchmark | Current or Studied Level | What it Measures | Why it Matters |
|---|---|---|---|
| Fed target range | 3.75%–4.00% | Policy-rate floor | Raises the base return available in dollar markets |
| 1-year Treasury | 4.45% | Low-risk dollar alternative | Main opportunity-cost benchmark for investors |
| Aave USDC vs 1-year Treasury | -31 bps avg. | Stablecoin lending spread | Shows Aave lenders did not consistently earn a premium |
| Aave underperformance frequency | 78% of intervals | Consistency of yield shortfall | Shows the gap was not just a one-off |
| Morpho median USDC vault | +65 bps avg. | Higher-yield vault spread | Clears Treasuries, but with more volatility |
| Morpho volatility | 3.3x Aave | Yield variability | Shows extra return came with a rougher ride |
Anthony DeMartino, co-founder and CEO of Sentora, points to CDOR as the better lever for judging on-chain credit.
Sentora helped build that benchmark, which tracks overnight borrowing rates on USDC and USDT inside Aave V3, the largest decentralized credit market.
DeMartino told CryptoSlate:
“Correlation between SOFR and CDOR has been very low, so a Fed hike should not be expected to pull onchain rates materially higher, and SOFR is the wrong anchor for pricing onchain exposure.”
That argument works alongside the Treasury comparison, adding a second lens without replacing it.
The one-year Treasury measures what an investor gives up by choosing crypto lending over the safest available alternative, while CDOR measures what borrowing dollars inside Aave costs on any given day.
A useful accounting of crypto yield needs both figures, since a return that clears CDOR but misses the Treasury rate has still failed the more basic opportunity-cost test.
| Benchmark | What It Captures | Best Use in the Article | Limitation |
|---|---|---|---|
| 1-year Treasury | Return on low-risk government debt | Measures investor opportunity cost | Does not reflect on-chain borrowing demand |
| SOFR | Secured overnight dollar funding rate | Useful for traditional dollar markets | DeMartino argues it is the wrong anchor for on-chain credit |
| CDOR | Overnight USDC/USDT borrowing in Aave V3 | Measures native on-chain credit conditions | Does not by itself prove investors are paid enough |
| Vault net APY | Investor-facing return after fees | Shows what users actually receive | Can hide volatility, leverage, liquidity, and tail risk |
| Required premium | Extra yield above the benchmark | Measures compensation for added crypto risk | No market-wide standard exists |
A European Central Bank working paper published Sept. 14 found that monetary-policy transmission into DeFi stablecoin deposit rates is weak and unstable in the short term.
Rates can even move in the opposite direction from Fed policy entirely before converging over a longer horizon, and deleveraging in crypto markets often drives that short-run divergence more directly.
Borrowers unwind positions and reduce the organic demand that sets on-chain borrowing costs.
Coin Metrics data shows where that premium currently stands. Aave’s USDC yield trailed the one-year Treasury by 31 basis points on average, while Morpho’s median USDC vault beat the same Treasury benchmark by 65 basis points, but carried roughly 3.3 times the annualized volatility of the Aave figure.
DeMartino noted:
“The premium over CDOR is where smart contract, liquidity, and credit risk are compensated, but there is no standard rate that can be applied here.”
In his account, the fair premium depends entirely on the specific protocols, curators, and assets an investor is exposed to.
As a purely analytical exercise, a plain stablecoin vault might reasonably need to clear the higher of the Treasury rate or CDOR plus another 100 to 300 basis points. Curated or leveraged strategies would need 300 to 600 basis points above that same floor.
That range mainly shows why a 4.1% yield can look inadequate against 4.45% Treasuries, while even a 5.1% crypto yield can remain debatable once volatility and tail risk enter the picture.
Kraken’s newly launched xStocks Vaults let investors keep exposure to tokenized equities like SPYx, QQQx or NVDAx while the vault borrows stablecoins against that collateral and deploys the proceeds into DeFi reward strategies.
Returns convert back into the same token and compound automatically. Kraken currently advertises a 2% net annualized yield for SPYx and QQQx and 1.8% for NVDAx, already net of a 25% performance fee, with withdrawals taking three days and potentially longer under stress.
On a $10,000 SPYx position, that 2% yield works out to roughly $200 of additional annual reward, entirely separate from whatever the underlying stock itself does.
DeMartino explained that if the stock sells off, the smart contract automatically repays debt to keep the position from being liquidated. If the market rallies, it takes on more debt to preserve the yield.
A 2% loss specific to the crypto vault’s strategy would erase that entire year’s incremental return. A decline in SPYx’s price is a separate risk any equity token holder would face regardless of the vault, and keeping those two loss sources distinct is key.
| Scenario | What Happens to Crypto Borrowing Demand | What Happens to Yield | What Investors Need to Watch |
|---|---|---|---|
| Bull case | BTC-driven borrowing demand stays strong | CDOR rises from on-chain utilization, independent of Fed policy | Whether DeFi yields clear Treasuries by a meaningful margin |
| Base case | Borrowing demand holds but does not surge | Yields fluctuate around Treasury/CDOR benchmarks | Whether net APY compensates for smart-contract and liquidity risk |
| Bear case | Risk appetite weakens and borrowers deleverage | Stablecoin deposit rates fall even as Treasuries stay elevated | Whether vaults pay less just as safe alternatives pay more |
| Stress case | Equity collateral falls, liquidity tightens, or execution delays emerge | Automated deleveraging protects positions but can compress returns | Whether a small yield premium is enough for tail risk |
The bull case has organic borrowing demand, still concentrated almost entirely in BTC by DeMartino’s account, staying strong enough that CDOR climbs on its own utilization independent of anything the Fed does.
Under that path, crypto lending yields can clear Treasuries through genuine on-chain demand, giving DeMartino’s argument that crypto runs its own rate cycle real support in the data itself, beyond just commentary.
The bear case has higher-for-longer Fed policy eventually cooling risk appetite broadly, weakening crypto activity and pushing borrowers to deleverage.
In that scenario, the ECB’s mechanism becomes the dominant force, with stablecoin deposit rates falling even as Treasuries stay elevated. Automated tools like Kraken’s margin management prevent liquidations but compress the yield investors collect, and crypto lending ends up paying less when the safe alternative sitting right next to it pays more.
Crypto yield products are already easy to access, though the harder question is whether that yield compensates for the risk sitting underneath it. No single benchmark, CDOR or Treasury alike, fully answers that.

Mutsamudu, Comoros, September 16th, 2026, Chainwire
MEXC, a pioneer in 0-fee digital asset trading, has released its July–August 2026 security report. The report shows that MEXC successfully intercepted all 215 reports involving risk-related funds during the period, covering approximately 38.66 million USDT. The total balance of the Futures Insurance Fund rose to 792 million USDT. Meanwhile, the reserve ratios for BTC, ETH, USDT, and USDC all remained above 100%.
In July and August 2026, the crypto industry recorded 184 security incidents, with reported losses totaling approximately $535 million. Phishing and fraud incidents, together with endpoint and supply-chain security incidents, accounted for approximately 48% of the total. At the same time, a growing number of attackers are using AI to auto-generate phishing content and help write malware, increasing the efficiency of their attacks. As attack methods become more diverse, promptly identifying and intercepting risk-related funds and strengthening cross-platform investigation have become increasingly important to reducing user losses.
All 215 Reports of Risk-Related Funds Successfully Intercepted, Covering 38.66 million USDT
In July and August, MEXC assisted with 215 reports involving externally stolen or fraud-related funds flowing into the platform. All 215 cases were successfully intercepted, covering 38,655,490 USDT. Of these cases, 42 involved assistances with judicial freezes. Compared with the previous reporting period, the number of successfully intercepted cases increased by approximately 2,971%, while the value of intercepted funds increased by approximately 12,646%.
In tracking and handling risk-related funds, MEXC shared suspicious addresses with major industry participants, assisted in identifying fund flows, and supported verification and freezing procedures under established joint-investigation and law-enforcement cooperation procedures.
Over 20,000 Risk-Related Accounts Identified and Restricted, With More Than 600,000 USDT in Misdirected Assets Returned
In account risk identification, MEXC identified and restricted 20,752 accounts associated with risk-related activities during the period, an increase of 118.03% from the previous reporting period. The platform identified 5,288 risk groups, up 20.35%. By region of origin, these groups were concentrated primarily in the Commonwealth of Independent States (1,803), Nigeria (1,099), and Indonesia (976).
For user asset recovery, MEXC manually processed 818 applications for the return of misdirected assets, returning the equivalent of 602,225 USDT, an increase of 75.31% from the previous reporting period.
Futures Insurance Fund Reaches 792 million USDT, Strengthening Protection Against Negative Balance Risk
As of September 1, 2026, the total balance of the MEXC Futures Insurance Fund reached 791,696,422 USDT, an increase of 5.44% from the previous reporting period.
The Futures Insurance Fund covers negative balances that may arise during liquidation, providing a risk buffer during extreme market conditions and helping reduce the likelihood of auto-deleveraging (ADL). When a liquidated position is closed at a price better than the bankruptcy price, the remaining funds are credited to the fund. Users can view the real-time balance on the MEXC Proof of Trust page.
Reserve Ratios for Four Major Assets Remain Above 100%, With BTC at Approximately 288%
According to the proof of reserves disclosed for this period, MEXC maintained reserve ratios above 100% for four major assets, as follows:
The on-chain addresses corresponding to these reserve assets have been disclosed, allowing users to verify through the Merkle Tree whether their individual account balances were included in this proof of reserves.
As an additional layer of user asset protection, the MEXC Guardian Fund maintains a dual-reserve structure of USDT and BTC: USDT provides immediate liquidity support, while BTC serves as a long-term reserve asset across market cycles. MEXC plans to expand the fund from $100 million to $500 million, continuing to strengthen user asset protection. The relevant holding addresses are listed below:
Guardian Fund Wallet Addresses:
MEXC CEO Vugar Usi said, “Trust is the true reserve currency of this industry. Protecting user assets means moving decisively the moment risk emerges, while giving users something they can verify for themselves, not just our word for it. We will continue to strengthen our ability to identify and intercept risk-related funds, deepen cooperation across platforms and with law enforcement, and help affected users recover their losses wherever possible. Our bi-monthly security reports are part of that commitment, allowing our security performance to be measured and tracked over time.”
About MEXC
Founded in 2018, MEXC is a leading global multi-asset trading platform built as your 0-fee gateway to infinite opportunities. Serving users across 170+ markets, MEXC provides simple and efficient access to crypto, stocks, tokenized assets, derivatives, and a growing range of TradFi-linked opportunities through one account and one gateway.
With 0 trading fees, deep liquidity, broad asset coverage, and a high-performance trading experience, MEXC is designed for retail users who want to discover earlier, act faster, and trade with fewer barriers. As crypto and traditional finance continue to converge, MEXC is committed to making global opportunities more accessible, helping users trade freely and MEXCmize every opportunity.
MEXC Official Website| X | Telegram |How to Sign Up on MEXC
MEXC PR team
media@mexc.com

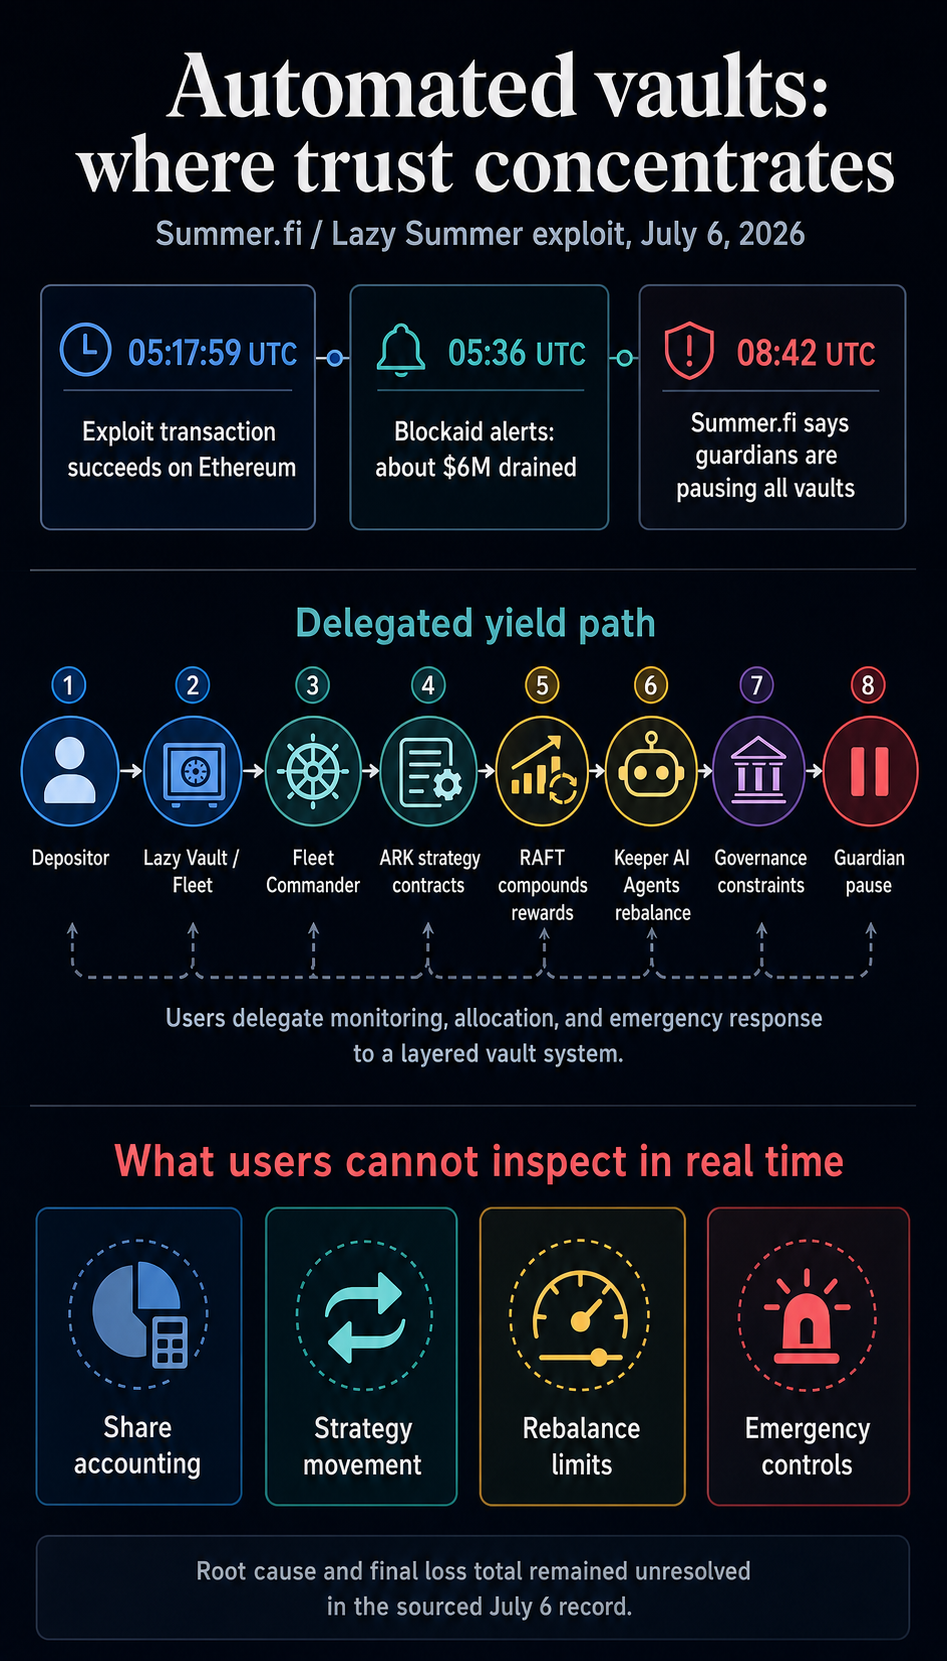
Summer.fi’s automated vault incident has put delegated DeFi yield back under pressure after Blockaid said on July 6 that its exploit detection system had identified an ongoing exploit and estimated that about $6 million had been drained at the time of its alert.
In a follow-up post, the security firm linked the exploit transaction, the exploiter address, the exploit contract, and the affected Summer.fi and Lazy Summer contracts.
The Etherscan transaction shows a successful Ethereum transaction at 05:17:59 UTC on July 6.
Summer.fi later said it was aware of the reported exploit, was investigating the root cause, and that protocol guardians were pausing all vaults across the Lazy Summer Protocol.
The final loss figure and cause remain unsettled until Summer.fi publishes a fuller incident review.

The exploit turns a product promise into a design question. Summer.fi’s documentation describes Lazy Summer as a set-and-forget protocol built around Lazy Vaults, auto-rebalancing, and simplified DeFi exposure.
That simplicity rests on several contract roles. Summer.fi’s docs describe Lazy Vaults, also known as Fleets, as coordinated contract systems comprising a Fleet Commander, ARKs, and RAFT.
The Fleet Commander manages deposits, withdrawals, and allocation; ARKs implement yield strategies; RAFT harvests and compounds rewards.
The protocol’s rebalancer adds another layer of trust. Summer.fi says Keeper AI Agents can reallocate assets across ARKs within constraints set through FleetCommander and governance, including limits on how much value can move and how often.
That layered design created the boundary that the exploit exposed.
A depositor is trusting share accounting, strategy contracts, keeper execution, governance limits, and emergency controls to behave correctly while capital moves without manual approval from each user.

Automation moves user risk into systems built to monitor, rebalance, and select strategies on the user’s behalf.
Summer.fi’s documentation points to audits and an Immunefi bug bounty, which remain important parts of the security stack. The incident still shows why live accounting, allocation, and pause assumptions need to be legible to depositors as capital moves.
A recent CryptoSlate analysis found that known DeFi hack losses reached $780.3 million in Q2, turning exploit risk into a cost that users must price into yield.

The Summer.fi incident is a more explicit version of that problem: the more invisible the yield machinery becomes, the more important it is for protocols to show where automation stops, and user exposure begins.
The next signal is Summer.fi’s postmortem. A contained fault would make the incident a test of emergency controls. A deeper issue in vault accounting, permissions, or strategy movement would carry a broader warning for automated vault design.

Cathie Wood’s ARK Invest bought roughly $77 million of crypto stocks in June, adding $44 million of Coinbase (COIN), $25.25 million of Circle (CRCL), and $8.2 million of Bullish (BLSH) during Bitcoin’s worst month in four years, according to ARK’s daily trade disclosures.
The purchases extend a thesis both Wood and other funds have held through every crypto downturn: public companies offer a regulated, equity-market way to own the digital asset cycle without holding the coins directly.
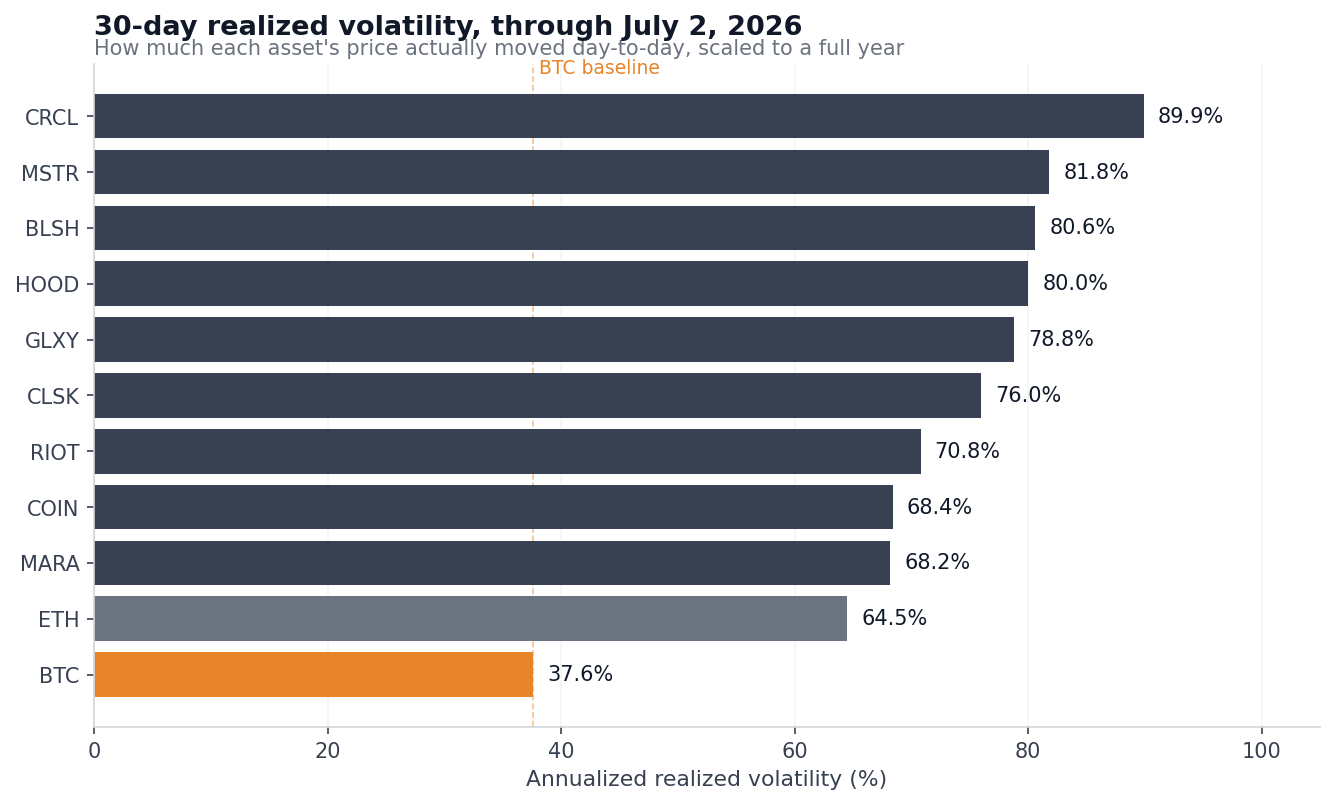
CryptoSlate’s analysis of daily price data through July 2 shows what that equity route actually cost this year. Across nine US-listed crypto stocks, annualized 30-day realized volatility, which measures how much a price actually moved day-to-day, scaled to a full year, ranged from 68% to 90%, roughly double Bitcoin’s 37.6%.
On a 90-day view, Circle’s reading is 103.6%, compared with Bitcoin’s 37.8%. Circle also sits 51.4% below its 2026 high, Strategy (MSTR) 48.6%, and Bullish 43.6%, all steeper falls than Bitcoin’s own 36.4% pullback from its January peak near $97,000.
That volatility gap alone could describe a leveraged Bitcoin bet, but the correlation data points in a different direction. Correlation measures how tightly two assets move together, on a scale from 1.00 (perfect lockstep) down to 0 (no relationship).
Over the last 90 trading days, Circle, Robinhood (HOOD), and Bullish moved in step with Bitcoin, with correlations of only 0.55 to 0.58, meaning Bitcoin’s daily swings accounted for roughly a third of these stocks’ daily moves. The rest is company-specific risk: quarterly earnings, competition, financing, and dilution from new share issuance.
Investors buying stocks for crypto exposure received partial exposure to the coin and, on top, a full second layer of equity-market risk.
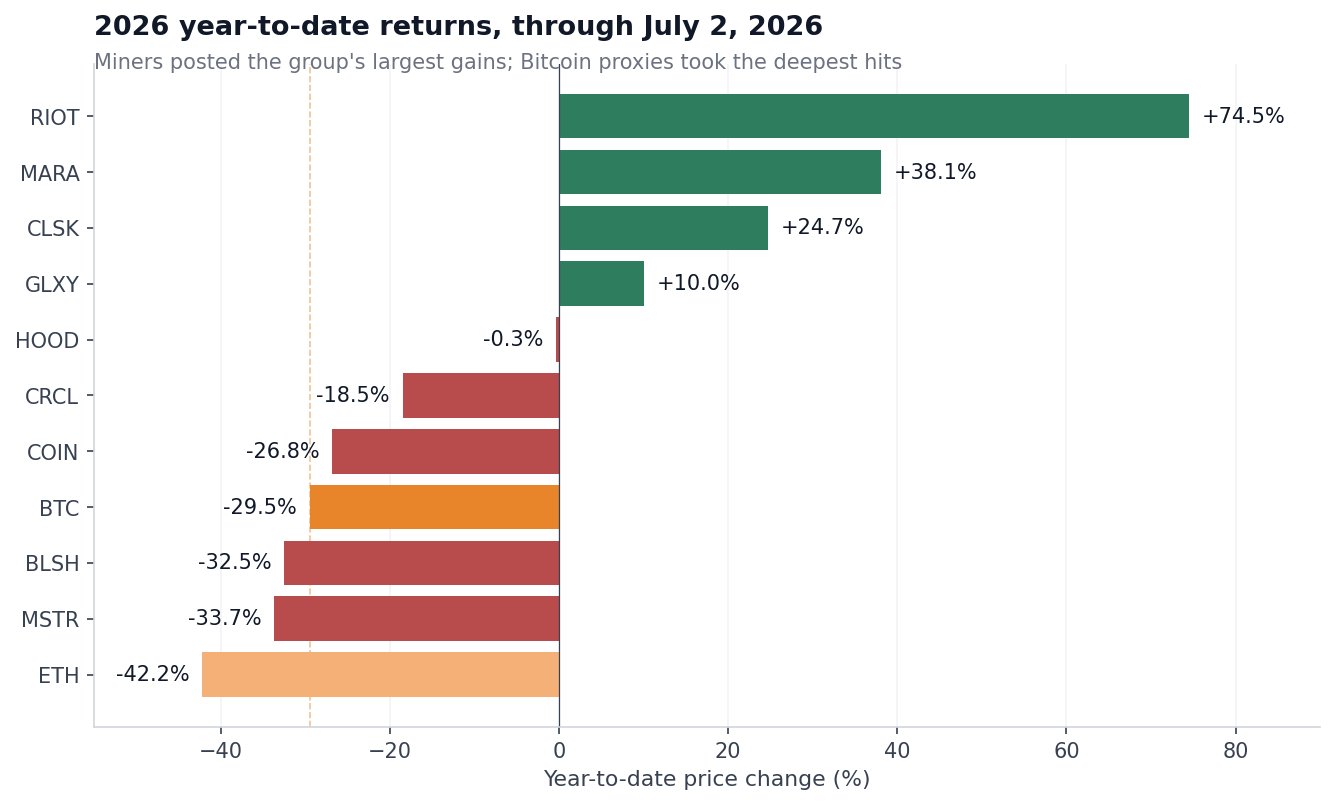
Here is the full picture from the price data. Year-to-date returns run from the last close of 2025. Beta measures how much a stock moves per 1% swing in Bitcoin, so a beta of 1.5 implies the stock rises about 1.5% when Bitcoin rises 1%, and falls further when Bitcoin falls. Betas and correlations are calculated over 90 trading days.
| Asset | 2026 return | Drawdown from 2026 high | 30-day realized vol | BTC beta | BTC correlation |
|---|---|---|---|---|---|
| BTC | -29.5% | -36.4% | 37.6% | 1.00 | 1.00 |
| ETH | -42.2% | -48.8% | 64.5% | 1.25 | 0.90 |
| COIN | -26.8% | -35.3% | 68.4% | 1.26 | 0.75 |
| HOOD | -0.3% | -8.5% | 80.0% | 0.96 | 0.58 |
| CRCL | -18.5% | -51.4% | 89.9% | 1.18 | 0.55 |
| BLSH | -32.5% | -43.6% | 80.6% | 0.89 | 0.58 |
| MSTR | -33.7% | -48.6% | 81.8% | 1.59 | 0.85 |
| GLXY | +10.0% | -28.3% | 78.8% | 1.44 | 0.71 |
| MARA | +38.1% | -16.5% | 68.2% | 1.20 | 0.65 |
| RIOT | +74.5% | -22.9% | 70.8% | 1.07 | 0.56 |
| CLSK | +24.7% | -32.9% | 76.0% | 1.23 | 0.67 |
Strategy is the one name where the Bitcoin proxy label fits. Its beta of 1.59, combined with a correlation of 0.85, describes leveraged Bitcoin exposure delivered through an equity. The stock behaved accordingly during the selloff, falling further than the coin in both the year-to-date figures and the drawdown from its 2026 high.
Coinbase comes closest to a balanced Bitcoin trade. It fell slightly less than BTC this year at -26.8%, with a beta of 1.26 and the second-highest correlation to Bitcoin in the group. Even so, its realized volatility ran nearly double Bitcoin’s, and the stock still trades 60.6% below its July 2025 record of $419.78. Anyone who bought near that top lost more than a holder who bought Bitcoin at its October 2025 record of $126,223.
Circle is the best example of equity risk masquerading as crypto exposure. Its correlation with Bitcoin is the lowest in the group, and its 90-day volatility is 103.6%, the highest. The reason showed up on June 30, when CRCL dropped 17.5% in a single session after the debut of Open USD, a rival stablecoin backed by more than 140 companies, including Coinbase, Stripe, Visa, Mastercard, and BlackRock.
Bitcoin’s price had almost nothing to do with that move. Stablecoin issuance is a payments and competition business, and Circle’s shareholders absorbed a competitive shock unique to that business.
Robinhood goes the other way and proves the same point. The brokerage is roughly flat for the year at -0.3%, with the shallowest 2026 drawdown in the group at 8.5%, because crypto is one slice of its much larger stock, options, and derivatives business. Diversification cushioned the slide somewhat, but HOOD delivered only a small fraction of the crypto exposure a buyer might have wanted on the way up.
The miners are the strangest result in the dataset. Riot gained 74.5% this year, MARA 38.1%, and CleanSpark 24.7%, while Bitcoin fell 29.5%. That outperformance came from the sector’s ongoing conversion into AI and high-performance computing landlords, a shift CryptoSlate has tracked as miners signed tens of billions of dollars in compute contracts and sold down their Bitcoin treasuries.
Their betas still sit above 1, so they swing with Bitcoin on any given day, though the year’s total gains came from AI hosting revenue that has nothing to do with the coin’s price.
The Bitcoin comparison base is far from calm. Volmex’s BVRV index of Bitcoin’s 30-day realized volatility bottomed at 24.5 in late May and climbed back to 41.6 by early July, after peaking at 68.7 during a separate February episode. Most of the stocks doubled that reading anyway.
Bitcoin holders face price risk. Equity holders in a Bitcoin-linked company face that plus everything else that can happen to a company: dilution, loss of the premium the market once paid, financing pressure, and changes to the capital plan.
Strategy experienced all of it inside a single month. In late June, the firm’s mNAV, or multiple of net asset value, fell below 1 for the first time. mNAV compares a company’s enterprise value (its market capitalization plus debt, minus cash) to the market value of Bitcoin on its balance sheet.
A value below 1 means the market values the entire business at less than the cash it holds. Strategy held 847,363 BTC as of its June 22 disclosure, worth roughly $50 billion at the moment mNAV fell through the threshold.
Falling below 1 breaks the model that built the company. Strategy’s flywheel, the self-reinforcing cycle at the core of the business, depended on the stock trading at a premium to the value of its Bitcoin holdings.
That premium allowed Michael Saylor’s team to issue new common and preferred shares at prices above the underlying coin’s value, then use the proceeds to buy more Bitcoin, adding Bitcoin-per-share for existing holders on every raise.
Below an mNAV of 1, the same process destroys value, because the company would be selling Bitcoin exposure at a discount to the coins it already holds. CryptoSlate reported on this in January when the treasury sector split into premium and discount operators.
Strategy’s market capitalization stood at $29.54 billion at the end of June, less than half its 2024 peak above $71 billion, and all four of its preferred stock series, separate share classes that pay fixed dividends and helped fund Bitcoin purchases, traded near record lows.
The company’s response confirms how different equity risk is from coin risk. On June 29, Strategy announced a share buyback program and authorized up to $1.25 billion in Bitcoin sales to build a liquidity cushion for preferred dividends and interest expenses. That came weeks after its first Bitcoin sale since 2022, a small 32 BTC disposal on June 1.
Shares closed 12.6% higher on the announcement, snapping an eight-day losing streak. The largest corporate holder of Bitcoin now has board-approved authority to sell into a weak market because its financing structure requires cash that the equity market has stopped providing on the old terms. A direct Bitcoin holder is not tied to that constraint.
That is the context for ARK’s buying. On June 25 alone, Wood’s funds added 35,023 Robinhood shares worth about $3.27 million alongside fresh Coinbase, Circle, and Bullish positions as all four crypto stocks fell.
Wood pairs the purchases with a seven-figure long-term Bitcoin target, and at current prices, her funds are accumulating businesses at steep discounts to 2025 valuations.
The data tells us what those businesses actually are: MSTR is levered Bitcoin exposure with dilution risk attached; Circle is a payments company in a stablecoin market-share fight; and Robinhood is a diversified brokerage with a crypto sideline. Buying all of them is a portfolio bet across different business models, with crypto exposure ranging from amplified to almost incidental.
Every stock in the group has an investment case on its own terms. Coinbase beat Bitcoin this year, Robinhood protected capital, and the miners posted the best returns in the sector.
But does the equity wrapper reduce risk relative to owning Bitcoin directly? Across nine names, the wrapper either amplified Bitcoin’s swings or added a second layer of company-specific risk with little to do with the coin’s price.
The crypto stocks that protected capital this year did so by growing revenue streams with their own drivers, meaning AI hosting contracts, brokerage flows, and payments products, with Bitcoin a smaller input to the outcome.

Stockholm, Sweden, June 19th, 2026, Chainwire
PremiumBlock brings leveraged prediction markets, liquid 24/7 FX perpetuals and Web3 poker together in one wallet-native platform via premiumblock.org
PremiumBlock today announced the launch of its non-custodial risk hub for decentralized prediction markets, perpetual futures and Web3 poker, giving crypto users one wallet-native destination to create markets, trade outcomes, access perps and participate in on-chain poker without relying on a centralized custodian.
PremiumBlock is built around a simple idea: the next generation of crypto speculation will not be limited to order books or one-directional prediction markets. Users want to price real-world events, express conviction with leverage, trade crypto volatility, and control their bankroll from the same wallet. PremiumBlock brings those use cases together in a single interface designed for speed, maximal liquidity and instant withdrawals.
The platform’s prediction market layer allows users to create and participate in markets around crypto, sports, politics, culture, macro events and world news. Unlike platforms where market creation is tightly curated, PremiumBlock is designed for user-created markets, giving communities the ability to surface the questions they believe deserve liquidity.
PremiumBlock also supports leveraged prediction-market positions, with up to 2.5x leverage available on selected markets. The feature gives experienced users a way to express stronger conviction on event outcomes while operating inside a defined collateral framework. As with any leveraged product, participants should understand volatility, liquidation risk, and market-resolution rules before entering a position.
Alongside prediction markets, PremiumBlock offers crypto perpetual futures for traders who want long or short exposure without traditional expiry dates. The perps layer brings a familiar derivatives format into the same wallet-native environment as the platform’s event markets, reducing the need for users to move capital between separate prediction-market, exchange and gaming applications.
PremiumBlock’s Web3 poker product adds a third pillar to the platform’s risk ecosystem. Built for crypto-native users who value bankroll control, the poker experience is designed around fast deposits, instant withdrawals and non-custodial fund management. The goal is to offer a transparent alternative to legacy poker rooms where withdrawal delays, account controls and operator custody can create unnecessary friction.
“PremiumBlock was built for users who want direct market access without waiting on approvals, custodians or withdrawal queues,” said Baqir Hussain at PremiumBlock. “Prediction markets, perps and poker all revolve around information, timing and risk. Bringing them together in one non-custodial environment gives users a more flexible way to participate in the markets they understand.”
PremiumBlock enters the market as prediction platforms continue to move further into mainstream crypto conversation. Polymarket helped popularize event markets for crypto-native users, while Kalshi brought regulated event contracts into broader public discussion. PremiumBlock expands the category with a model focused on user-created leveraged markets, perpetual futures and wallet-based bankroll control.
The platform is available now for users seeking a crypto-native environment where event markets, leverage, perps and poker can exist side by side. PremiumBlock does not provide investment advice. Users are responsible for understanding applicable laws, smart contract risk, market volatility and the rules of any market or game before participating.
About PremiumBlock
PremiumBlock is a non-custodial risk hub for decentralized prediction markets, perpetual futures and Web3 poker. The platform combines user-created event markets, up to 2.5x leverage, crypto perps and instant withdrawals in a wallet-native experience designed for crypto users who want direct control over funds.
Farhat
Chadi
PremiumBlock
team@premiumblock.org

Automated yield protocols built DeFi’s most persuasive retail pitch that depositing into a vault was all a user needed to do, with the protocol handling everything else.
For users wanting exposure to Curve’s boosted yields without manually managing CRV locks, vote power, wrappers, gauges, and incentives, Stake DAO offered a product that packaged the full stack behind a simple interface and, in doing so, also packaged what could break.
According to Blockaid, an attacker minted over 5.4 trillion vsdCRV on Arbitrum through a suspected compromise of a deployer key and began swapping tokens for ETH.
The attacker altered LayerZero-related peer configuration to forge a cross-chain message before minting 5,446,744,073,709 vsdCRV, converting a portion into roughly 43.78 ETH, with liquidity constraining realized extraction far below the nominal mint.
Stake DAO told users not to interact with vsdCRV while the situation was active. The incident spread to Curve, which warned users in an affected Arbitrum LlamaLend market, and Beefy Finance paused a connected vault with exposure to Curve and Convex.
Stake DAO’s Liquid Lockers let users deposit governance tokens like CRV, receive liquid sdTokens, and access boosted yield and governance exposure without managing the Curve-locking stack directly.
The vault interface hides all of that and, in doing so, also hides the deployer keys, cross-chain messaging trust, wrapper-token accounting, and oracle dependencies that the exploit traveled through.
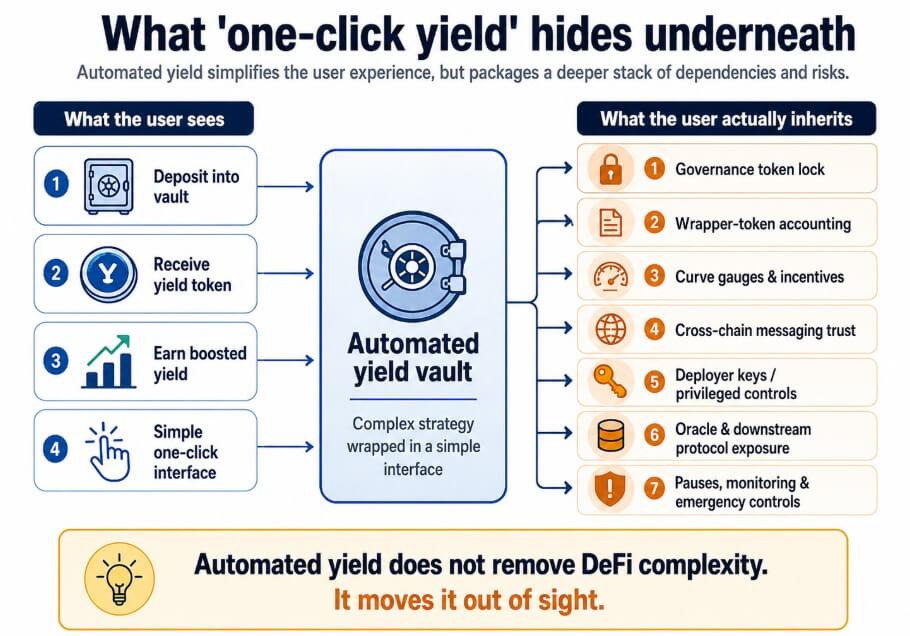
Automated yield moves DeFi complexity out of sight, a relocation that only becomes visible when something in the hidden layer breaks.
Ido Ben-Natan, co-founder and CEO of Blockaid, framed the security disconnect in a note:
“Wherever there is value on-chain, there will be attackers trying to exploit it, and that’s true regardless of how simple or complex a protocol’s strategy is. Two things matter here. First, whether protocols have the right governance infrastructure in place to ensure there is no easy point of failure to exploit. Second, having a real-time on-chain security tooling that validates every transaction before execution.”
April 2026 was DeFi’s worst month for exploits, with roughly $635 million extracted across 28 incidents, driven by social engineering, bridge spoofing, and AI-assisted reconnaissance.
Manuel Aráoz, who co-founded OpenZeppelin and served as its CTO until 2019, wrote that he now considers “all” of DeFi unsafe because AI coding agents have become “superhuman” at finding vulnerabilities, while defenders must fix every bug and attackers need only one.
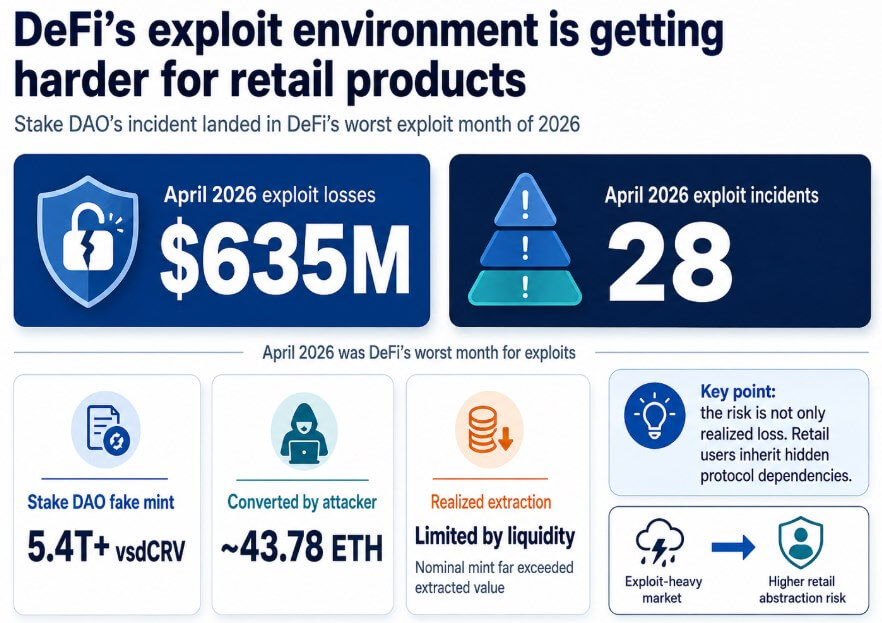
OpenZeppelin publicly rejected that claim, stating that Aráoz’s posts do not reflect the company’s position. The asymmetry he describes, though, has drawn serious attention beyond the attribution dispute.
Ben-Natan puts the defensive advantage in real-time tooling and adaptive threat detection:
“Hackers are increasingly leveraging AI to move faster and find new attack vectors. However, on-chain cybersecurity providers like Blockaid have deep experience using AI to stay well ahead. We continuously analyze and adapt to new threat patterns in real time, using AI agents for investigations, simulations, and malicious pattern matching.”
That real-time capability makes transaction validation a viable countermeasure to the speed edge attackers are gaining, and for automated yield protocols, governance controls, and monitoring have become the actual security layer that the vault interface depends on.
In the bear case, more key compromises, bridge incidents, oracle contagion, and vault pauses drive an abstraction discount into automated yield products.
Users demand higher returns to compensate for hidden stack risk, making it harder to sustain the one-click yield pitch without explicit risk disclosure, and smaller vaults lose TVL as integrations become risk-gated.
The incident pattern that defined April extends through the rest of the year, and each new incident reinforces the perception that yield automation bundles risks that users cannot independently evaluate.
In the bull case, protocols adopt the architecture Ben-Natan describes, consisting of governance controls that eliminate easy points of failure, real-time transaction validation, and continuous threat-pattern monitoring, and automated yield survives in a more standardized form.
Formal verification, multisig controls, and runtime monitoring become the default infrastructure, and the products that retain retail trust are those that disclose and manage the dependency stack.
Security vendors and risk dashboards are embedded in the vault interface itself, and the competitive edge moves from hiding complexity to proving which parts of it are under control.
| Scenario | What happens | Impact on users | Impact on protocols |
|---|---|---|---|
| Bear case | More key compromises, bridge incidents, oracle contagion, and vault pauses | Users demand higher yields for hidden risk | Smaller vaults lose TVL; integrations become risk-gated |
| Base case | Protocols add clearer disclosures, monitoring, and emergency controls | Retail still uses vaults, but with more caution | Security becomes part of the product UX |
| Bull case | Real-time validation, multisig controls, formal verification, and risk dashboards become standard | Users regain confidence in monitored products | Stronger protocols consolidate trust and liquidity |
The retail promise of automated yield was always about relocating complexity, and for years, the protocol absorbed that burden invisibly. The Stake DAO exploit shows what happens when the invisible layer breaks, and April’s record shows it breaking with increasing frequency.
The next automated yield product to win retail trust will earn it by showing users which parts of the stack are monitored, controlled, and isolated, and what the protocol does when any one part fails.

Key points:
Bitcoin (BTC) has dipped below $77,000, indicating that the bears are attempting to seize control. Glassnode said the true market mean at $78,300 has historically acted as a dividing line between bear and bull market regimes. If the price breaks sharply below the level, it suggests that the recent rally may have been a “local top within the ongoing bear market.”
Institutional investors seem to be selling, as evidenced by the sharp decline in the Coinbase premium over the past few days. LVRG research director Nick Ruck told Cointelegraph that the decline of the Coinbase premium signals selling from large holders, which “could weigh on near-term price momentum across major crypto assets.”
Crypto market data daily view. Source: TradingView
What is the crucial level that suggests the bulls are back in command? Independent analyst Filbfilb said in a post on X that the previous two bear markets had ended after “a >+20% weekly candle and a break of the weekly super trend.” If the current bear trend has to fail, BTC has to rise above the super trend level at $88,000.
Could BTC and select major altcoins hold on to their strong support levels? Let’s analyze the charts of the top 10 cryptocurrencies to find out.
BTC turned down at the 20-day exponential moving average ($78,280), suggesting the bears are attempting to take charge.
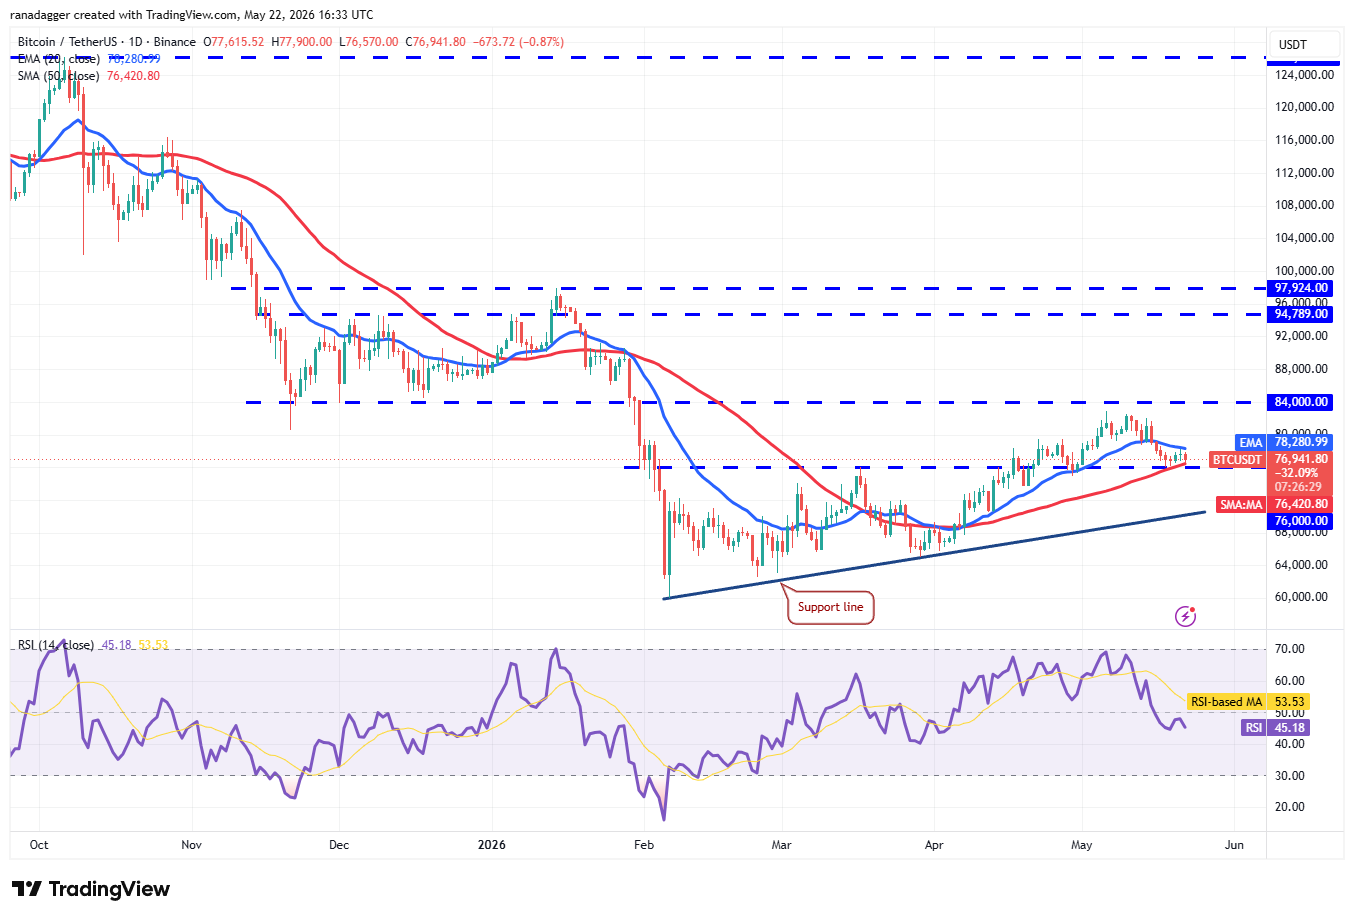
BTC/USDT daily chart. Source: Cointelegraph/TradingView
The $76,000 level is the critical support to watch on the downside, as a close below it would signal an advantage to the bears. That increases the risk of a drop to the support line, which is likely to attract buyers.
Time is running out for the bulls. They will have to push and maintain the BTC price above the 20-day EMA to gain the upper hand. If they do that, the BTC/USDT pair may begin its journey toward $82,000 and eventually reach the crucial $84,000 level.
Sellers are attempting to retain Ether (ETH) below the support line, but the bulls have kept up the pressure.
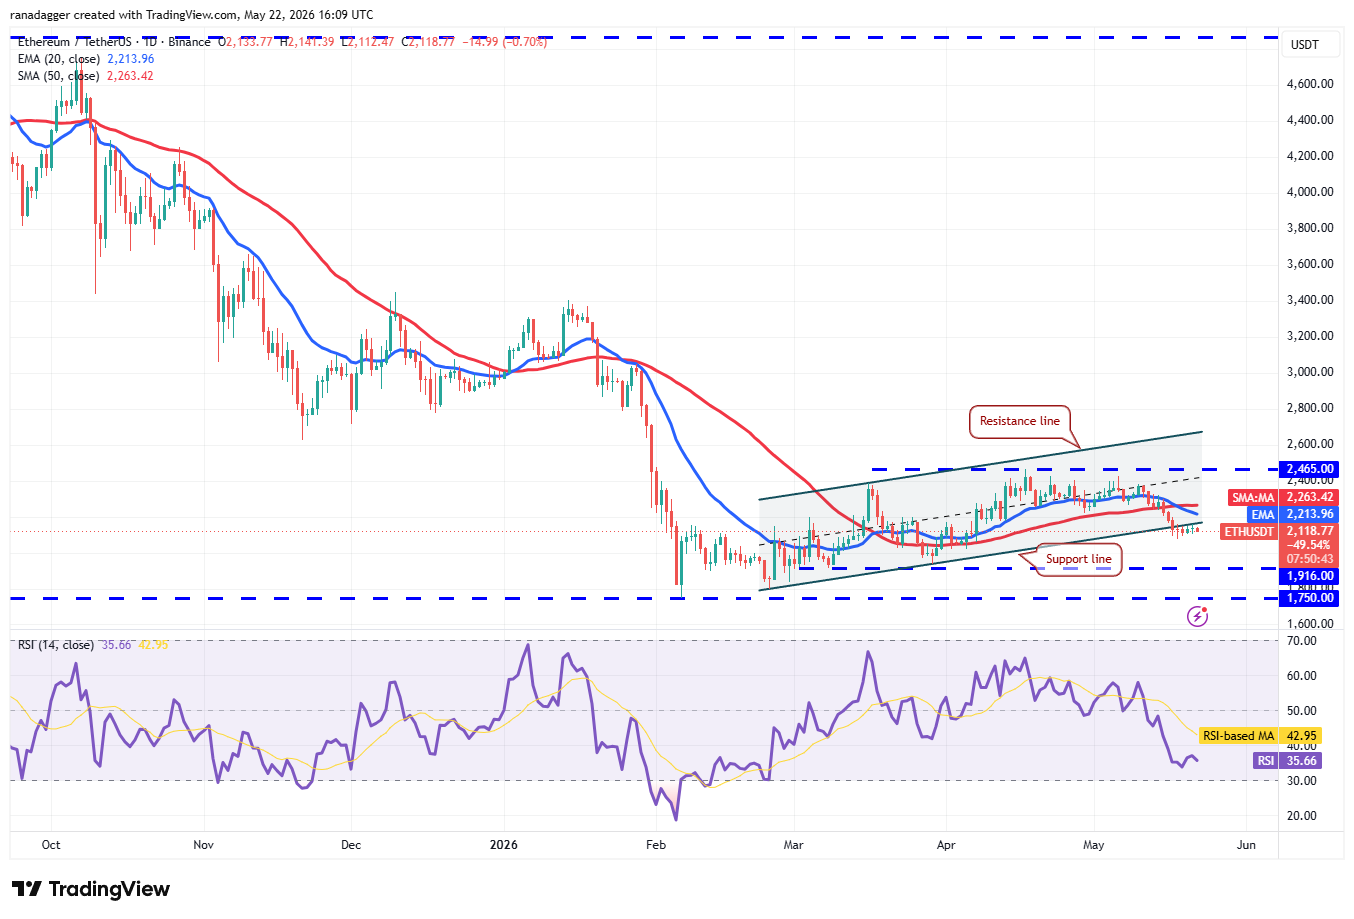
ETH/USDT daily chart. Source: Cointelegraph/TradingView
The bulls will have to drive the ETH price above the moving averages to signal a comeback. If they do that, it suggests that the break below the support line may have been a bear trap. The ETH/USDT pair may climb to $2,465 and then to the resistance line of the ascending channel pattern.
Contrary to this assumption, if the price declines from the current level or the 20-day EMA and breaks below $2,077, it would signal that the bears remain in control. That may sink the pair to the $1,916 support.
BNB (BNB) rose above the 20-day EMA ($650) on Wednesday, and the bulls are attempting to push the price to $687.
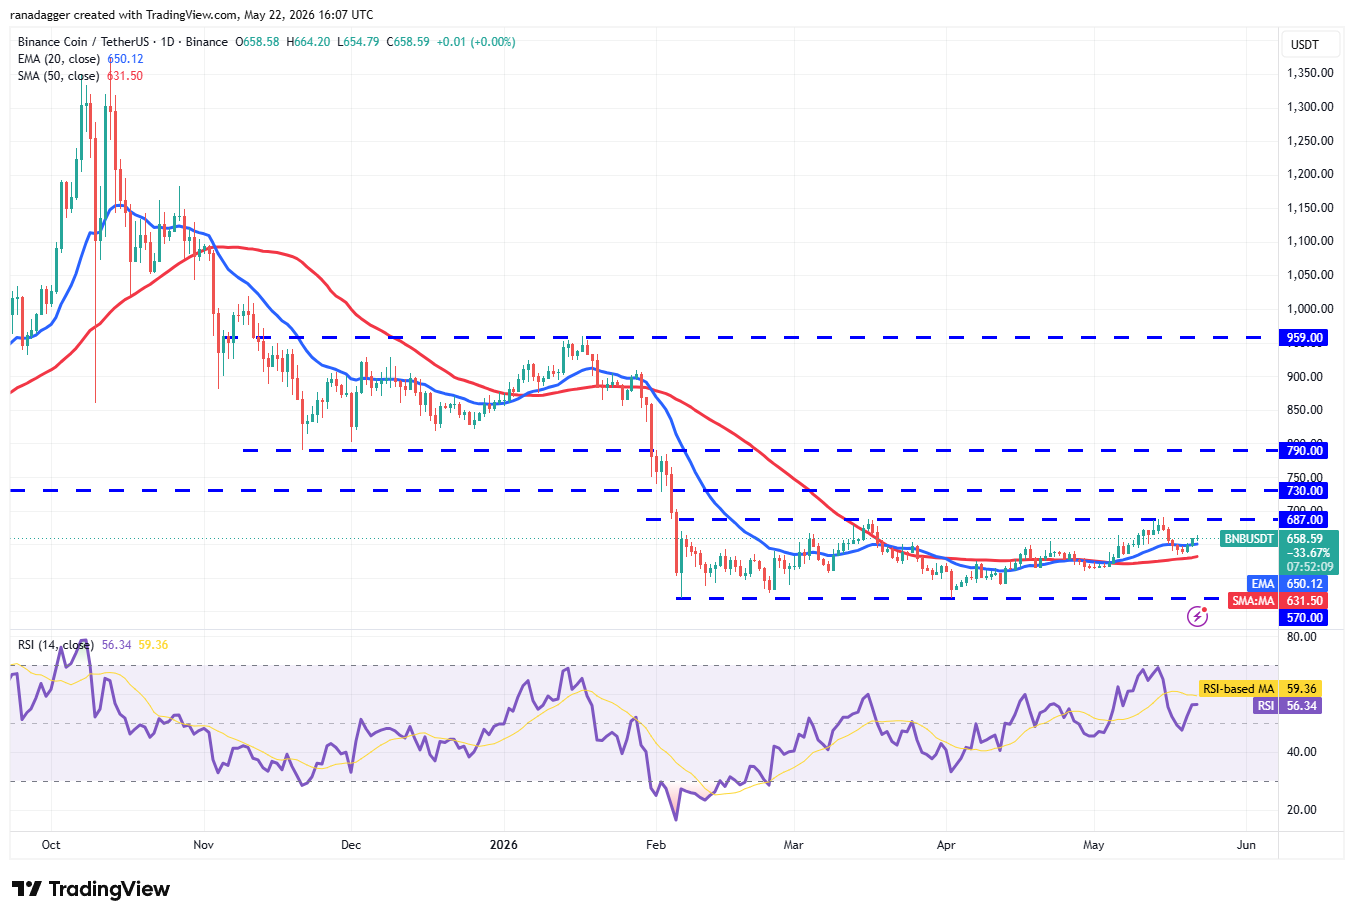
BNB/USDT daily chart. Source: Cointelegraph/TradingView
Sellers will attempt to defend the $687 resistance, but if the bulls prevail, the BNB/USDT pair may march toward $730 and then $790. Such a move suggests that the pair may have bottomed out at $570.
The bears are likely to have other plans. They will attempt to defend the overhead resistance and pull the BNB price below the 50-day simple moving average ($631). If they succeed, the pair may extend its stay within the $570 to $687 range for a while longer.
XRP (XRP) remains below the moving averages, indicating that the bears are in no mood to let go of their advantage.
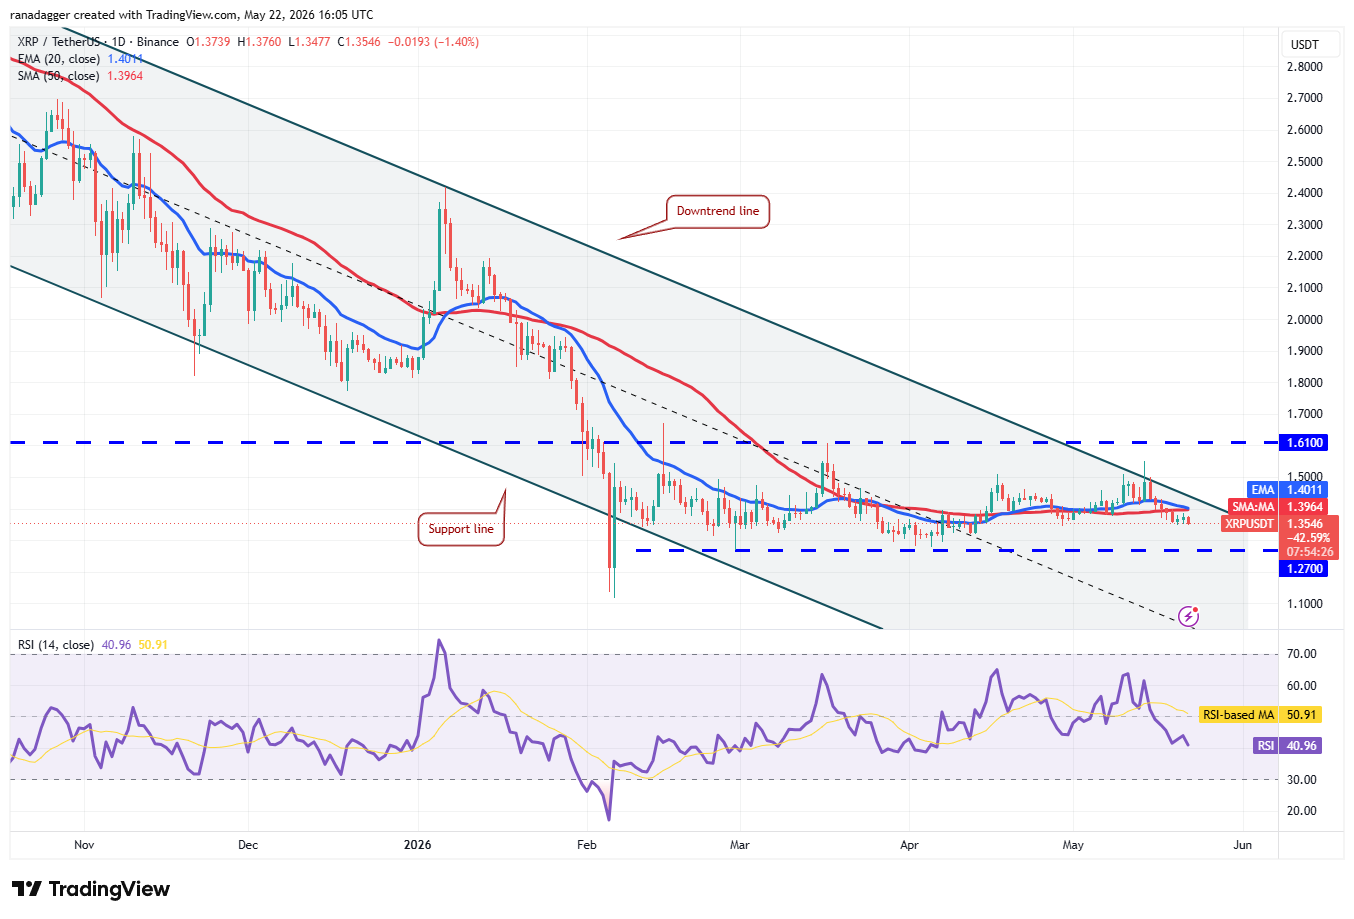
XRP/USDT daily chart. Source: Cointelegraph/TradingView
Sellers will attempt to strengthen their position by pushing the XRP price below the $1.27 support level. If they manage to do so, the XRP/USDT pair may plummet to $1.11, where buyers are expected to step in.
The first sign of strength will be a close above the downtrend line. The pair may then ascend to $1.61, a crucial level to watch. If buyers overcome the barrier, the pair may surge toward $2.40.
Solana’s (SOL) relief rally reached the 20-day EMA ($87.83), where the bears are expected to pose a strong challenge.
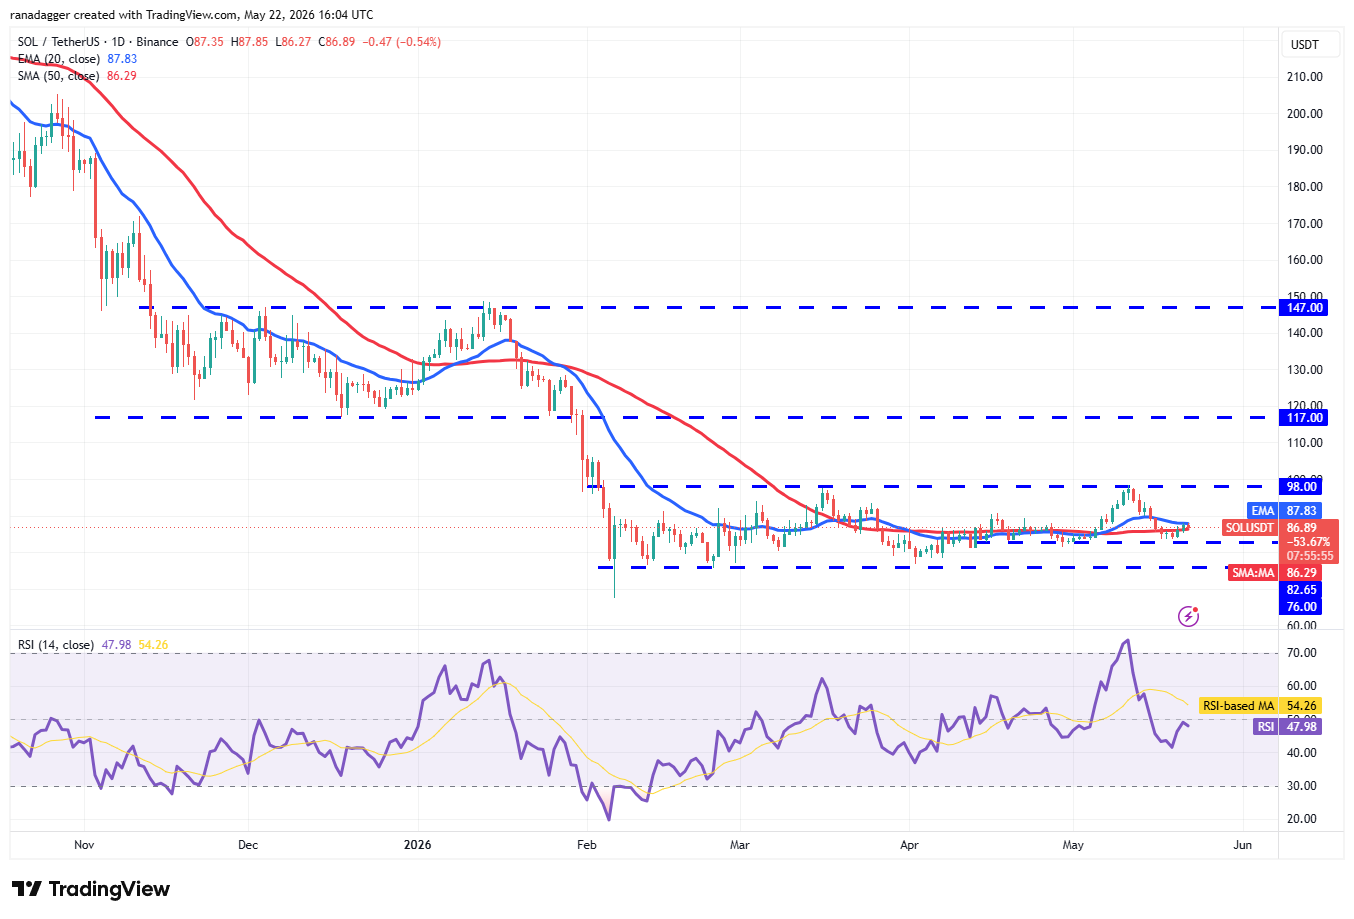
SOL/USDT daily chart. Source: Cointelegraph/TradingView
If buyers propel the SOL price above the 20-day EMA, it suggests demand at lower levels. The SOL/USDT pair may then climb to the $98 overhead resistance. A close above $98 signals the start of a new up move toward $117.
On the contrary, if the price declines sharply from the 20-day EMA and breaks below $82.65, it suggests the bears remain in control. The pair may then tumble to the $76 support.
Dogecoin (DOGE) turned up from the 50-day SMA ($0.10) on Wednesday, but the relief rally is facing resistance at the 20-day EMA ($0.11).
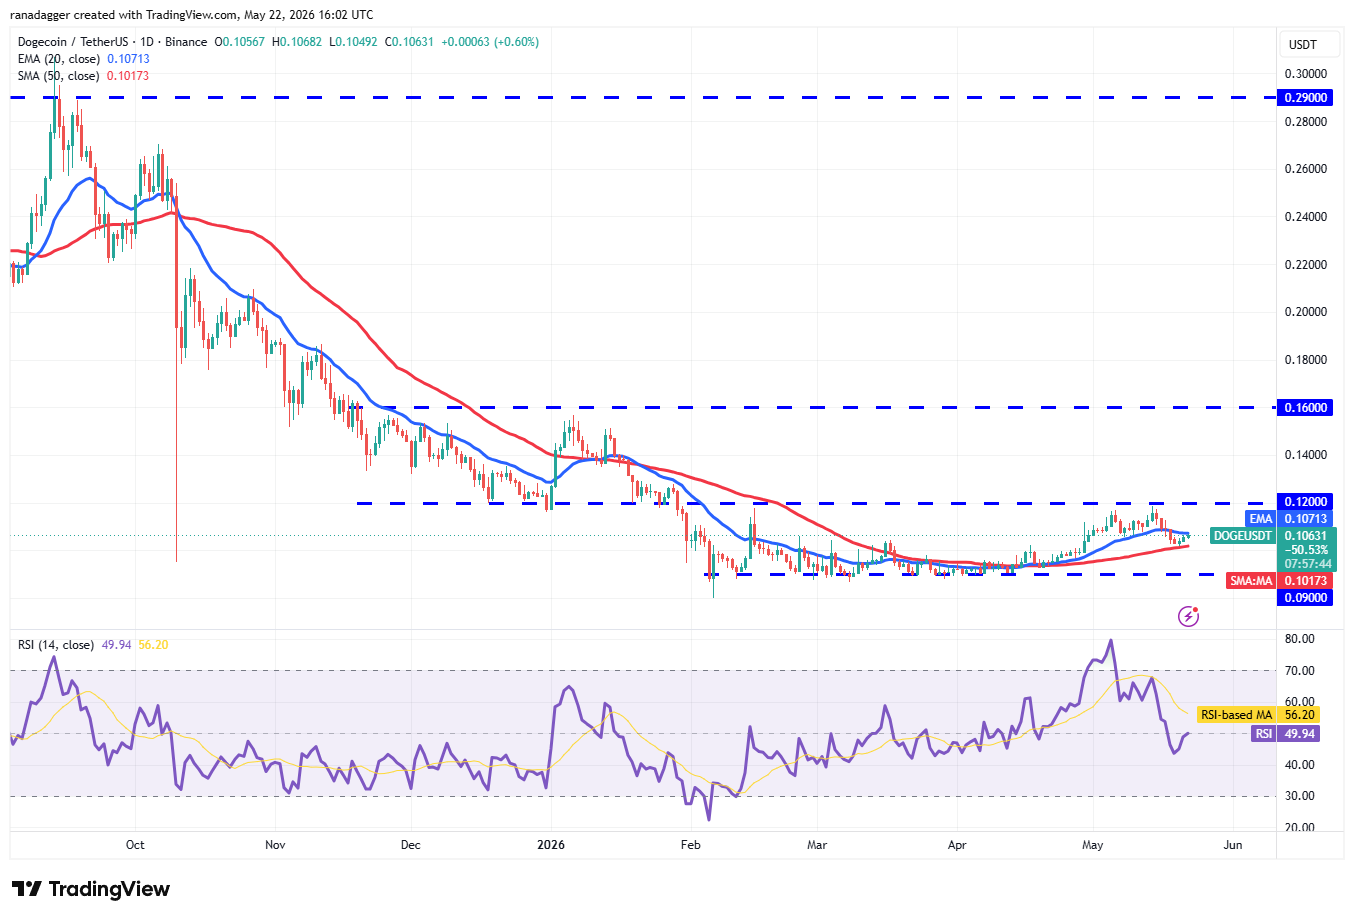
DOGE/USDT daily chart. Source: Cointelegraph/TradingView
If buyers pierce the 20-day EMA, the DOGE/USDT pair may rise to the $0.12 overhead resistance. Sellers are expected to defend the $0.12 level, as a close above it would signal a short-term trend change. The DOGE price may then soar to $0.14 and later to $0.16.
The 50-day SMA is the critical support to watch on the downside, as a break below it could sink the pair to the $0.09 level.
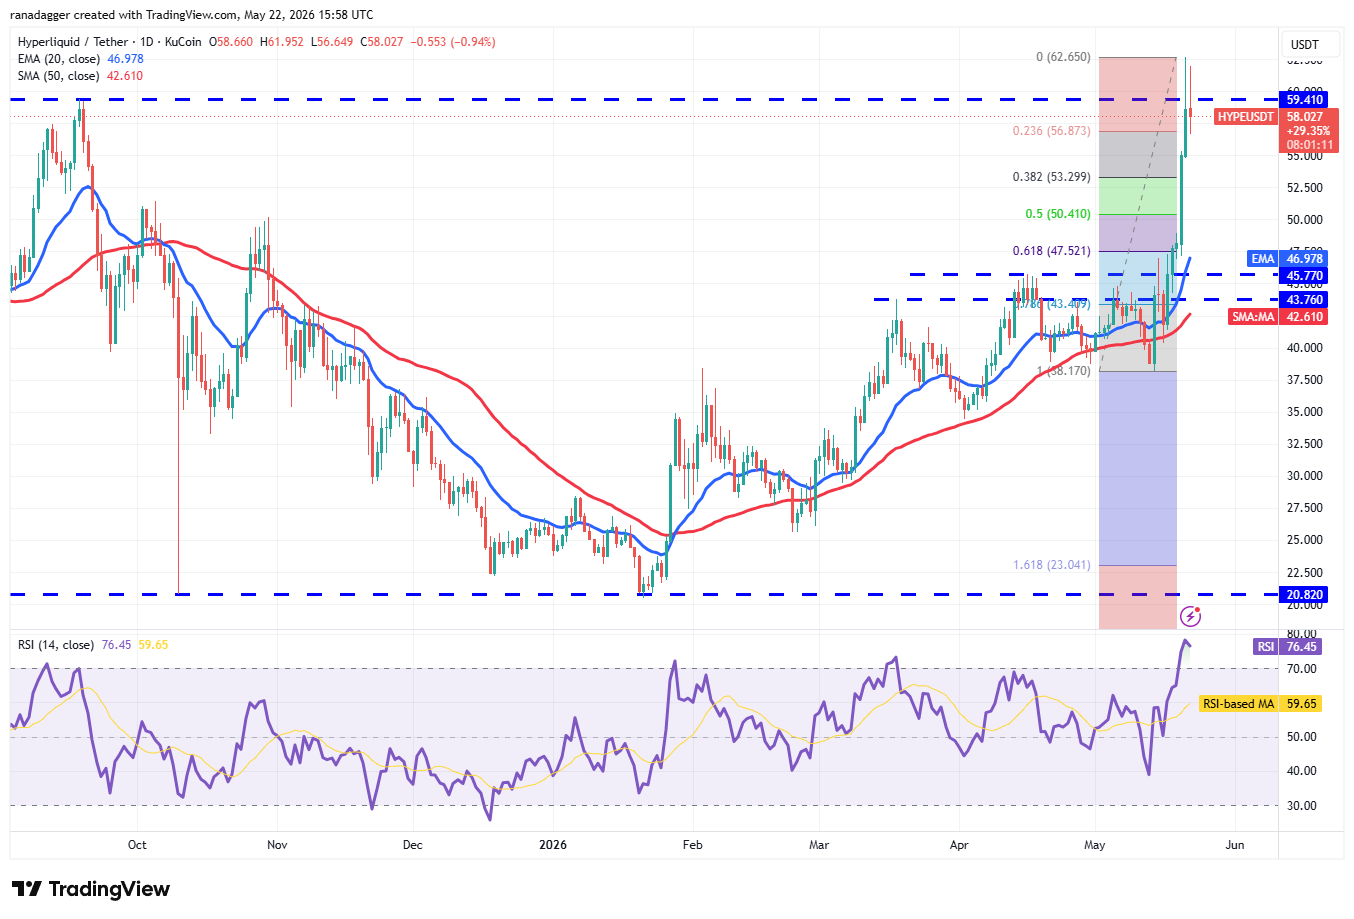
Hyperliquid (HYPE) continued its uptrend, skyrocketing to a new all-time high of $62.65 on Thursday.
HYPE/USDT daily chart. Source: Cointelegraph/TradingView
Sellers are fiercely defending the $59.41 level, as they have not allowed the bulls to close above it. The first support on the downside is the 38.2% Fibonacci retracement level of $53.29. If the HYPE price rebounds off the $53.29 level with strength, the bulls will again attempt to resume the uptrend. A close above $62.65 opens the door to a rally toward $77.
Alternatively, a close below the $53.29 level suggests that the short-term traders are booking profits. The HYPE/USDT pair may then tumble to the 50% retracement level of $50.41 and then the 20-day EMA ($46.97). The deeper the fall, the longer the time needed for the resumption of the uptrend.
Related: XRP adds 4,300 new wallets in 24 hours, but why is price stuck?
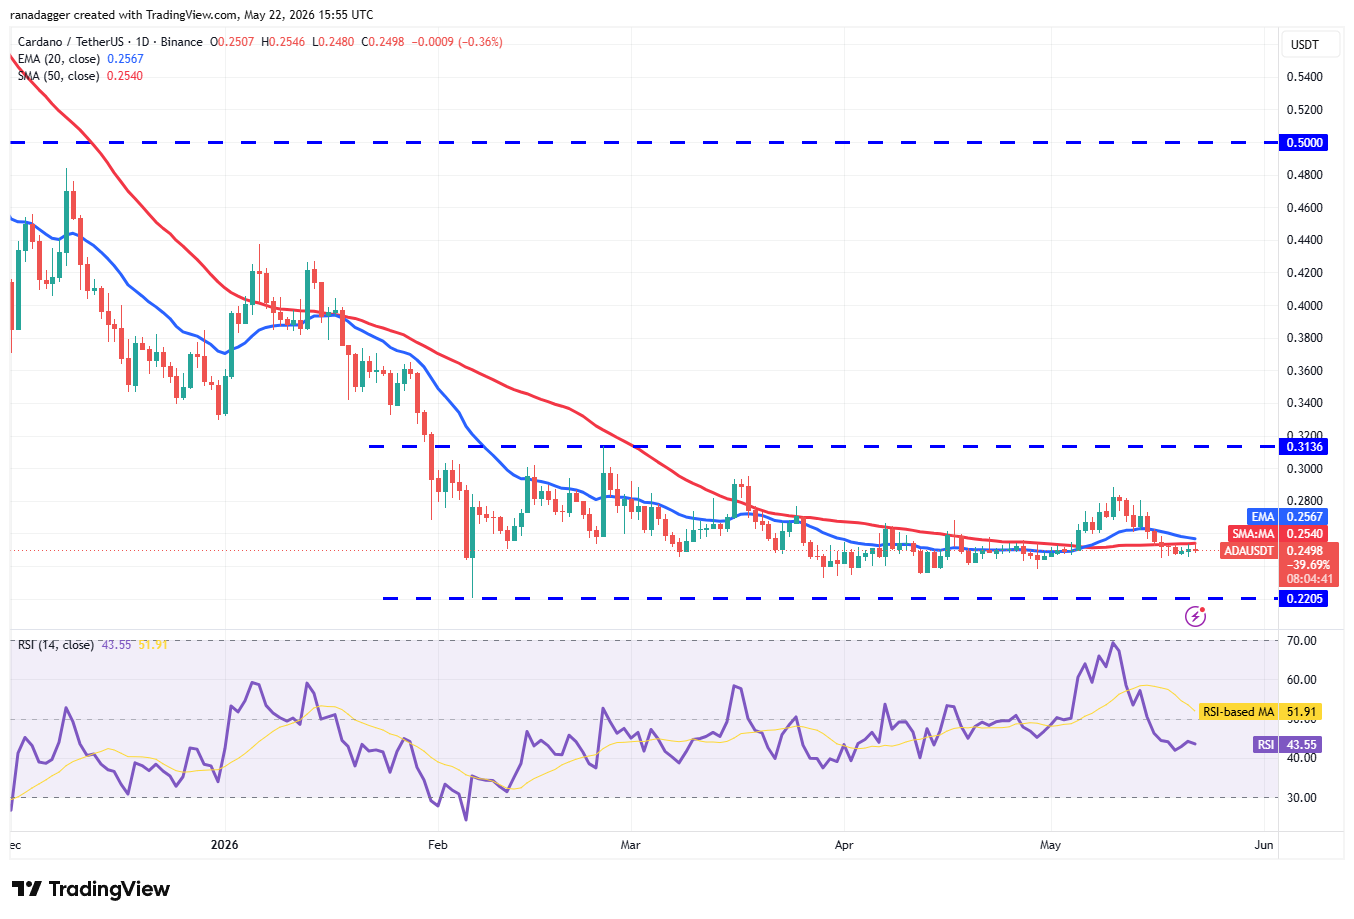
Cardano (ADA) has been trading just below its moving averages, suggesting the bulls have not given up.
ADA/USDT daily chart. Source: Cointelegraph/TradingView
A break and close above the 20-day EMA ($0.25) opens the doors for a recovery to $0.29 and, after that, to $0.31. Buyers will have to clear the $0.31 hurdle to signal the start of a new up move.
Instead, if the ADA price turns down from the moving averages, it suggests that the bears remain in control. There is support at $0.24, but if the level breaks down, the ADA/USDT pair may slump to the bottom of the $0.22 to $0.31 range.
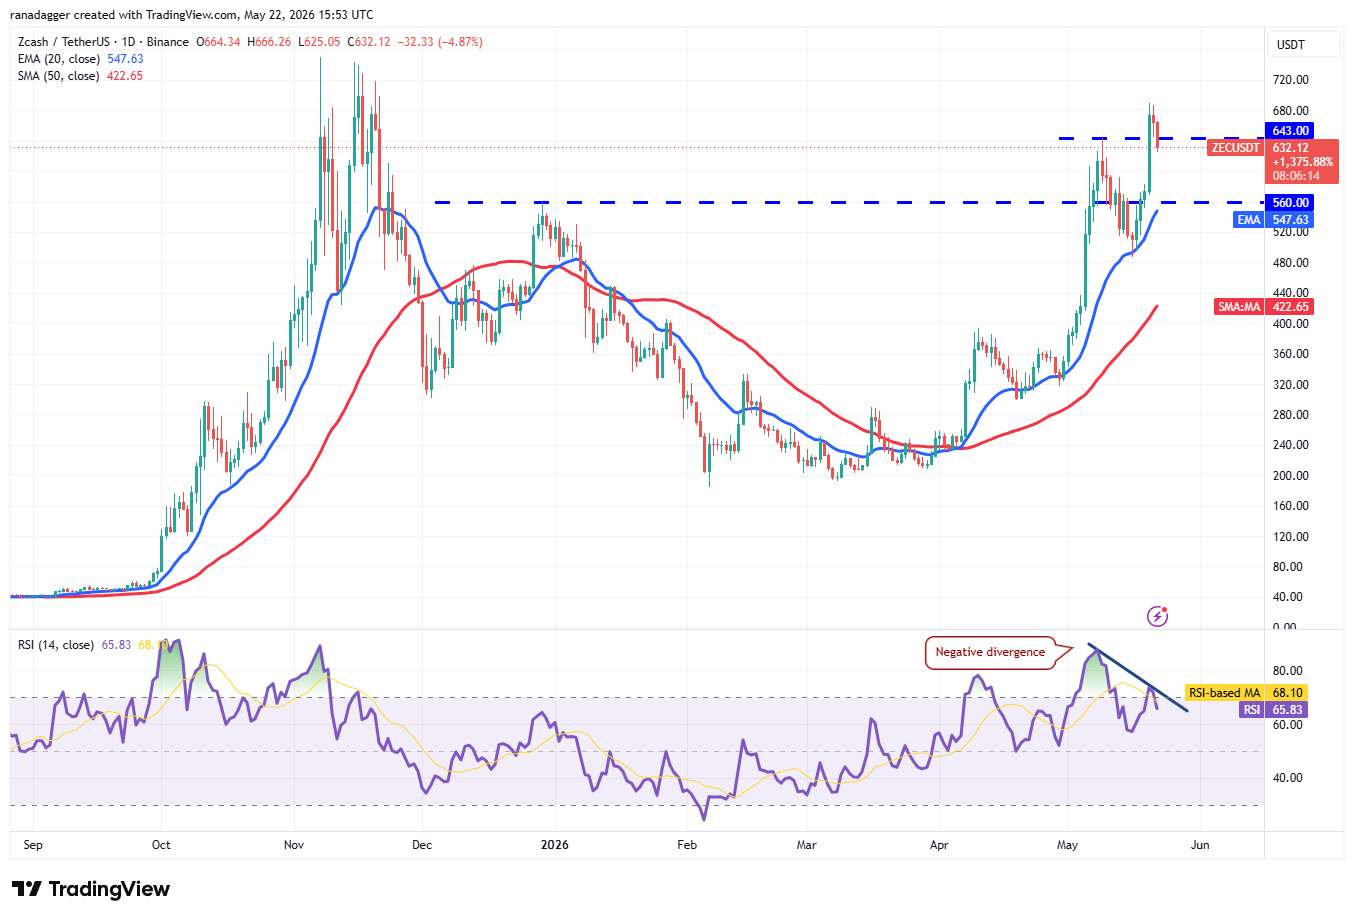
Zcash (ZEC) pole vaulted above the $643 resistance on Wednesday, but the bulls are struggling to sustain the higher levels.
ZEC/USDT daily chart. Source: Cointelegraph/TradingView
The relative strength index is forming a negative divergence, indicating that the bullish momentum is weakening. If the ZEC price closes below the $643 level, it signals the possibility of a deeper correction toward the 20-day EMA ($547).
If the ZEC/USDT pair turns up from the current level or the 20-day EMA, it indicates that the uptrend remains intact. The bulls will then make one more attempt to clear the $690 level, clearing the path for a rally to the $750 resistance.
Bitcoin Cash price prediction
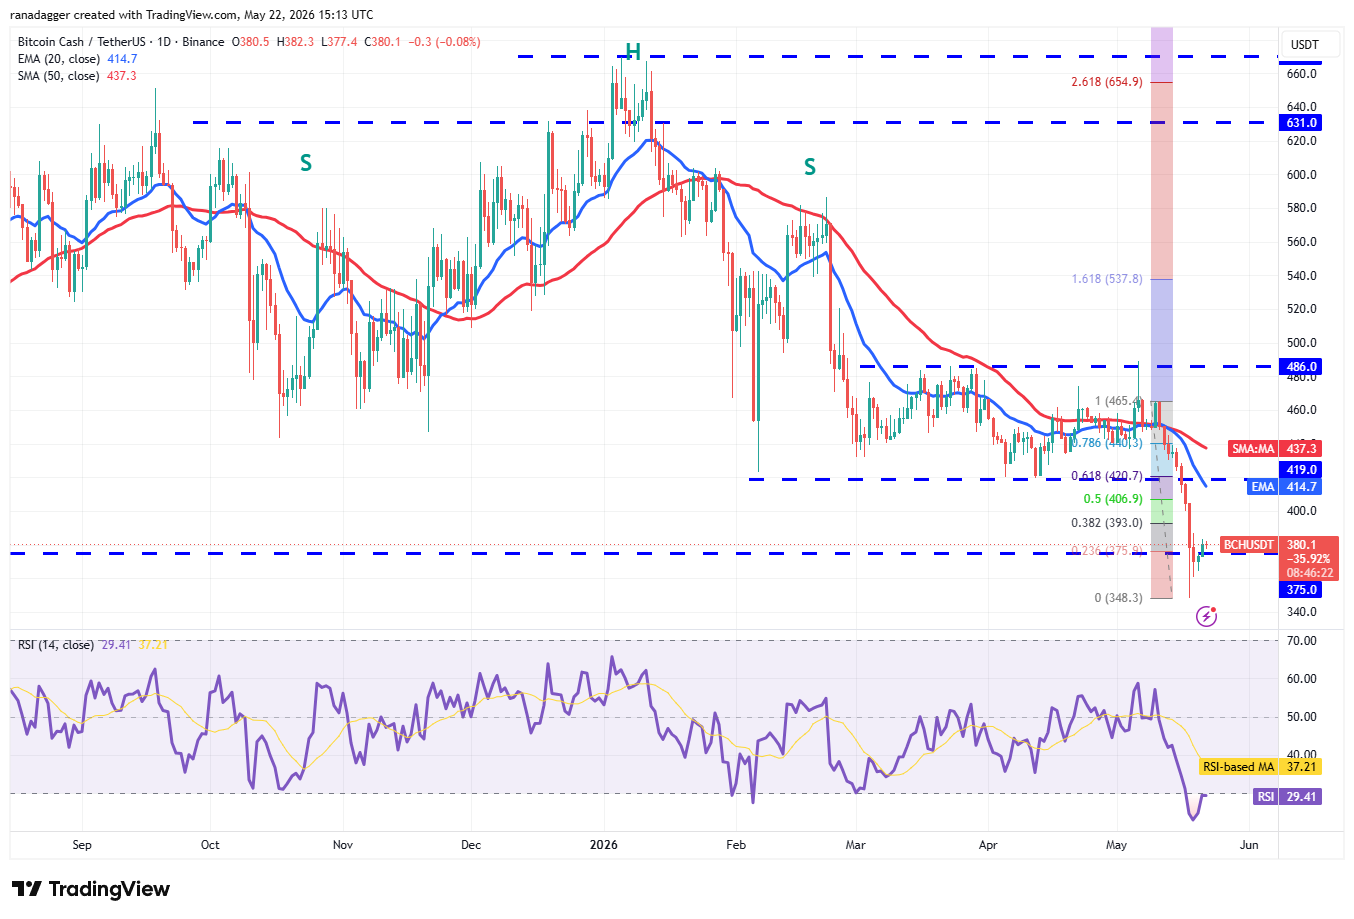
Bitcoin Cash (BCH) has risen above the breakdown level of $375, but the rebound lacks strength.
BCH/USDT daily chart. Source: Cointelegraph/TradingView
The relief rally is expected to face selling at the 38.2% Fibonacci retracement level of $393 and then at the 20-day EMA ($414). If BCH price declines from $393, the risk of a break below $348 increases. The BCH/USDT pair may then resume the downtrend and plunge to $300.
This negative view will be invalidated in the near term if buyers drive and maintain the price above the 20-day EMA.

Key Takeaways
The Republican side of the 2028 presidential race on prediction markets looks much more structured than the Democratic one, because there is already a traditional heir apparent in Vice President JD Vance.
Additionally, President Donald Trump keeps hanging over the field, including through hints about a possible third-term run that may never legally materialize but still warps the conversation.
Polymarket has attracted nearly $600 million in its contract for the Republican nominee, while Kalshi has reached $33 million. Those pale in comparison the $1 billion and $88 million, respectively, traded on the Democratic presidential nominee market.
On Polymarket’s Republican Presidential Nominee 2028 board, Vance leads at 38.9%, with Secretary of State Marco Rubio at 21.7%, Tucker Carlson at 4.5%, and Florida Gov. Ron DeSantis at 2.8%.
Trump is tied with Kentucky Rep. Thomas Massie and Donald Trump Jr. at 2%.
Kalshi’s 2028 Republican presidential nominee market tells the same basic story: Vance is the favorite, at 35%, with Rubio close behind at 27%. The field remains active enough that traders can still price multiple plausible paths if the vice president stumbles or if the party reorients around a different post-Trump figure. Trump at 2.7% trails Carlson, Trump Jr., and DeSantis, all below 5%.
The key difference from the Democratic side is that Vance’s position is not just a big name or platform. It is baked into the traditional vice-presidential succession logic that usually governs party heir-apparent politics.
Trump is constitutionally ineligible to run again, but that has not stopped the market from pricing his shadow.
Polymarket’s broader presidential and GOP nomination boards still absorb the possibility of a Trump‑style intervention in the party narrative. The market includes a recently-launched niche contract around whether the nominee could be a woman. That reflects that the GOP 2028 race is already being broken into symbolic sub-questions.
That matters because Trump’s continued presence, even as an off‑screen force, changes how traders think about the field:
One of the reasons the Republican 2028 market is more mature than it looks is that traders are already carving it into candidate-specific side bets. Polymarket has live individual markets for Vance and several other high-profile Republican names, and the platform’s nomination pages show enough depth to let traders price not only who will win but who is still viable.
Kalshi similarly offers a dedicated Who will run for the Republican nomination in 2028 market. That market suggests the party is priced in layers: who enters, who survives, who consolidates and who Trump blesses.
That layered structure matters because the GOP primary is likely to be less about ideological theater than about succession management. If Vance keeps the heir-apparent lane, the market can stay relatively stable. If not, traders will have to reprice quickly around Rubio, DeSantis, or a left-field candidate with Trump’s backing.
The 2028 presidential election odds are already behaving like a real heir-apparent race rather than a speculative dartboard, though a volatile Democratic nominee race could shake that up.
Vance is clearly out front in the Republican market, but the candidate-by-candidate boards all show that the field is still alive enough to move if the political environment shifts.
The 2028 Republican presidential race is early. But it is already structured around succession, and prediction markets are giving that structure real money and real depth.

Pat Evans
Pat Evans has nearly two decades of experience covering complex industries. Before joining Defi Rate in 2026, he spent more than 15 years writing about sports betting, food and beverage, construction, health care and sports business for national and regional outlets. He previously worked as a reporter and editor for publications including the Grand Rapids Business Journal, Front Office Sports, Legal Sports Report and iGaming Business, where he began in-depth reporting on prediction markets. Pat holds a political science degree from Michigan State University.


