The persistent discount suggests US spot buyers have remained less aggressive than overseas traders even as US Bitcoin ETF inflows turned positive in July.

 Live Chat

The persistent discount suggests US spot buyers have remained less aggressive than overseas traders even as US Bitcoin ETF inflows turned positive in July.

Bitcoin (BTC) demand on Coinbase points to early signs of market stabilization as BTC reclaimed the upper bounds of its range highs. The 14-day trend of the Coinbase Premium Index has remained in an uptrend, suggesting steady buyer interest despite traders taking $1.14 billion in profits, which pushed the daily Coinbase premium to a six-week low.
The Coinbase Premium Index dropped to -0.087 on May 19, its weakest reading since March 31. A negative premium means Bitcoin traded at a lower price on Coinbase than on Binance, signaling softer demand from US-based buyers.
BTC profit-taking accelerated as it rallied to $82,000 and holders realized 14,600 BTC ($1.14 billion) in daily profits on May 4. CryptoQuant noted unrealized profit margins climbed to 17.7% on May 5, the highest level since June 2025.
Bitcoin net realized profit and loss. Source: CryptoQuant
However, the longer-term trend for Coinbase paints a steadier picture. The 14-day simple moving average (SMA) of the premium index has remained above its February lows. Similar recoveries in the moving average preceded renewed spot demand on Coinbase during March 2025, shortly before Bitcoin pushed toward $110,000 in April-May 2025.
The daily premium readings still sit below zero, though the rising SMA points to easing sell-side pressure. Bitcoin also continues to hold above the $70,000–$75,000 range, a zone that previously attracted strong spot accumulation.
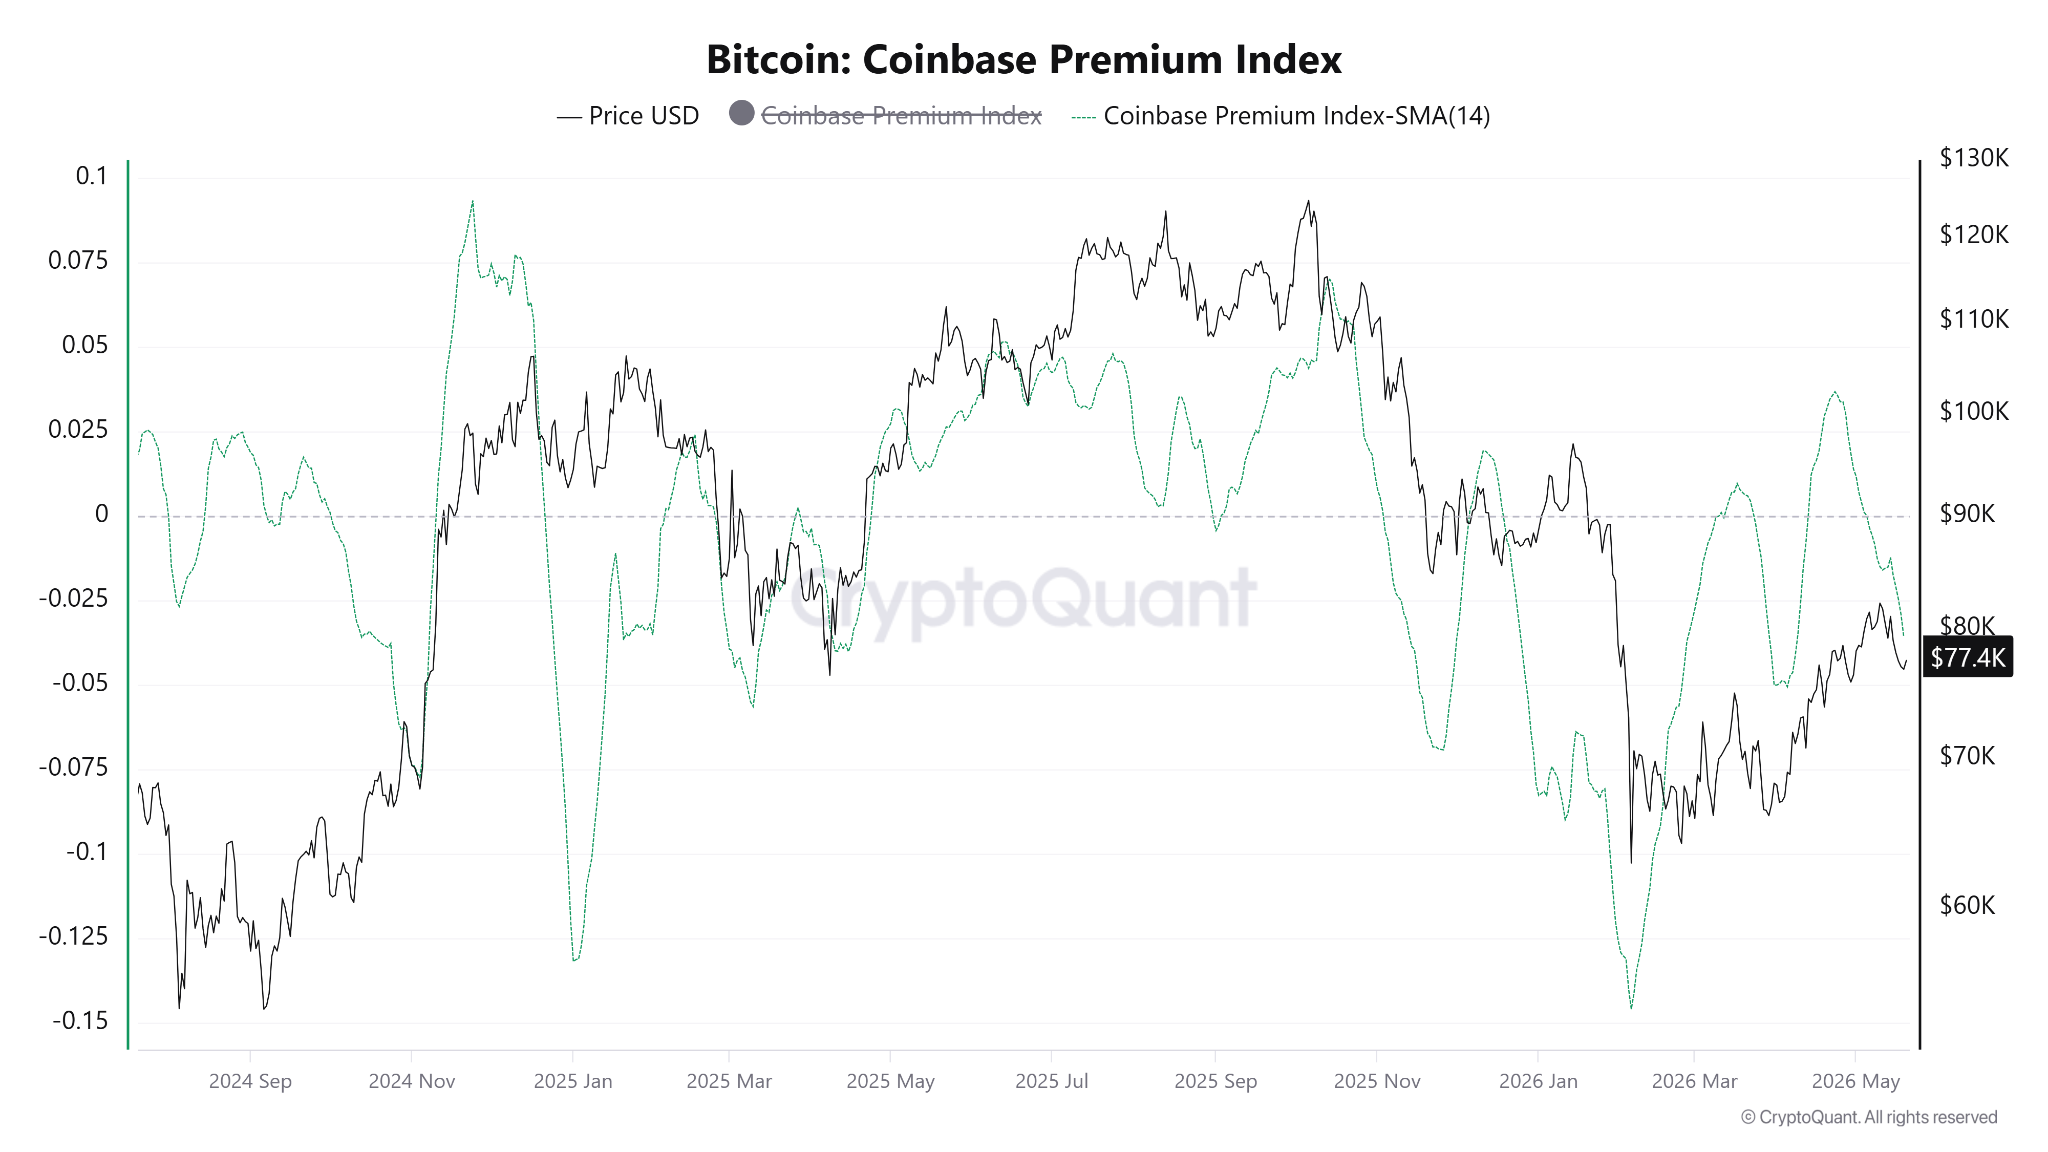
Bitcoin Coinbase Premium 14-day SMA. Source: CryptoQuant
Crypto analyst Amr Taha noted that activity across the Coinbase-linked network stayed elevated during the latest pullback. The Base blockchain revenue climbed to nearly $972,000 on May 19, exceeding late-March levels even as the Coinbase Premium Gap remained negative.
The divergence highlights steady network participation inside the Coinbase ecosystem while spot demand gradually rebuilds.
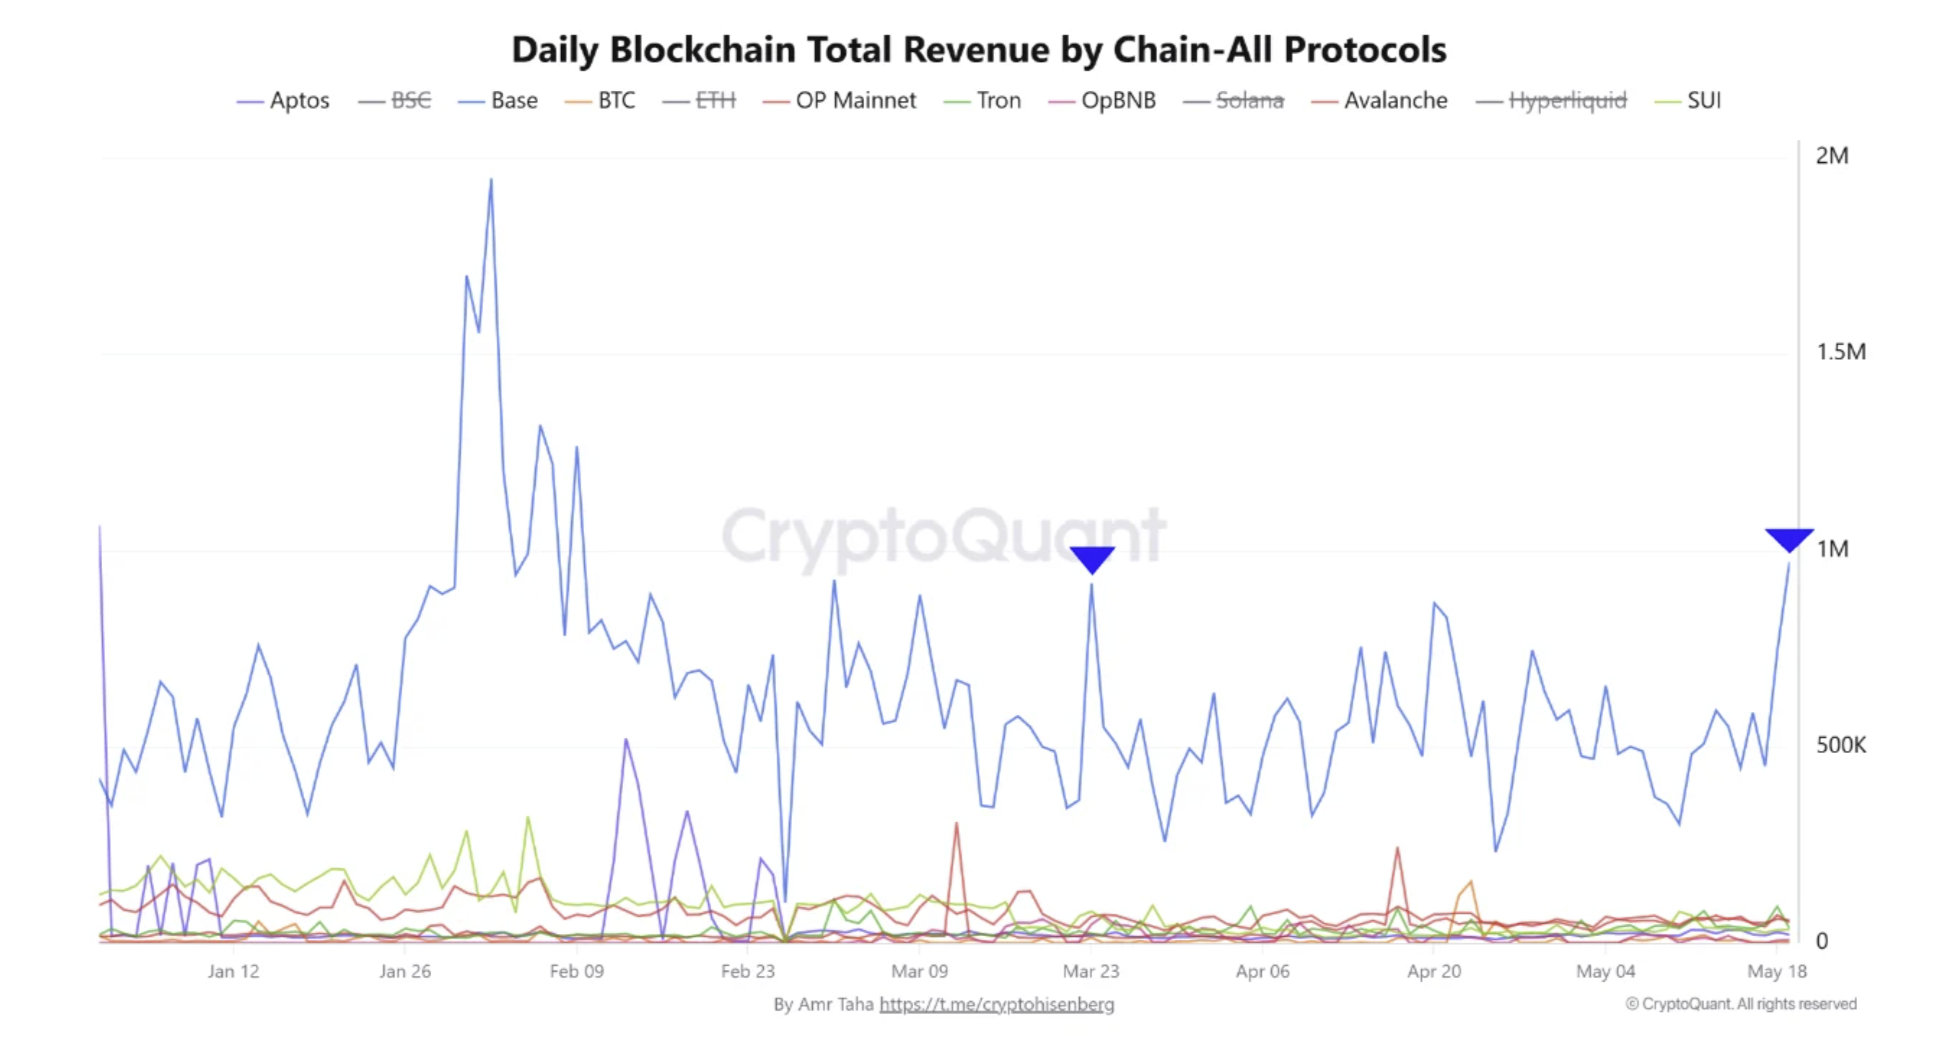
Daily blockchain total revenue by different protocols. Source: CryptoQuant
Related: This Bitcoin price model targets ‘conservative’ $255K by year-end
The daily chart of BTC still leans bullish after the rejection near $82,000. The price continues to trade above the 100-day exponential moving average (EMA) near $76,800, which is acting as key dynamic support.
The current retracement has held within the $76,000–$77,000 fair-value gap, keeping buyers active near recent accumulation levels. A recovery from this zone could reopen the path toward $80,000–$82,000, while the larger supply area near $86,000–$90,000 sits higher.
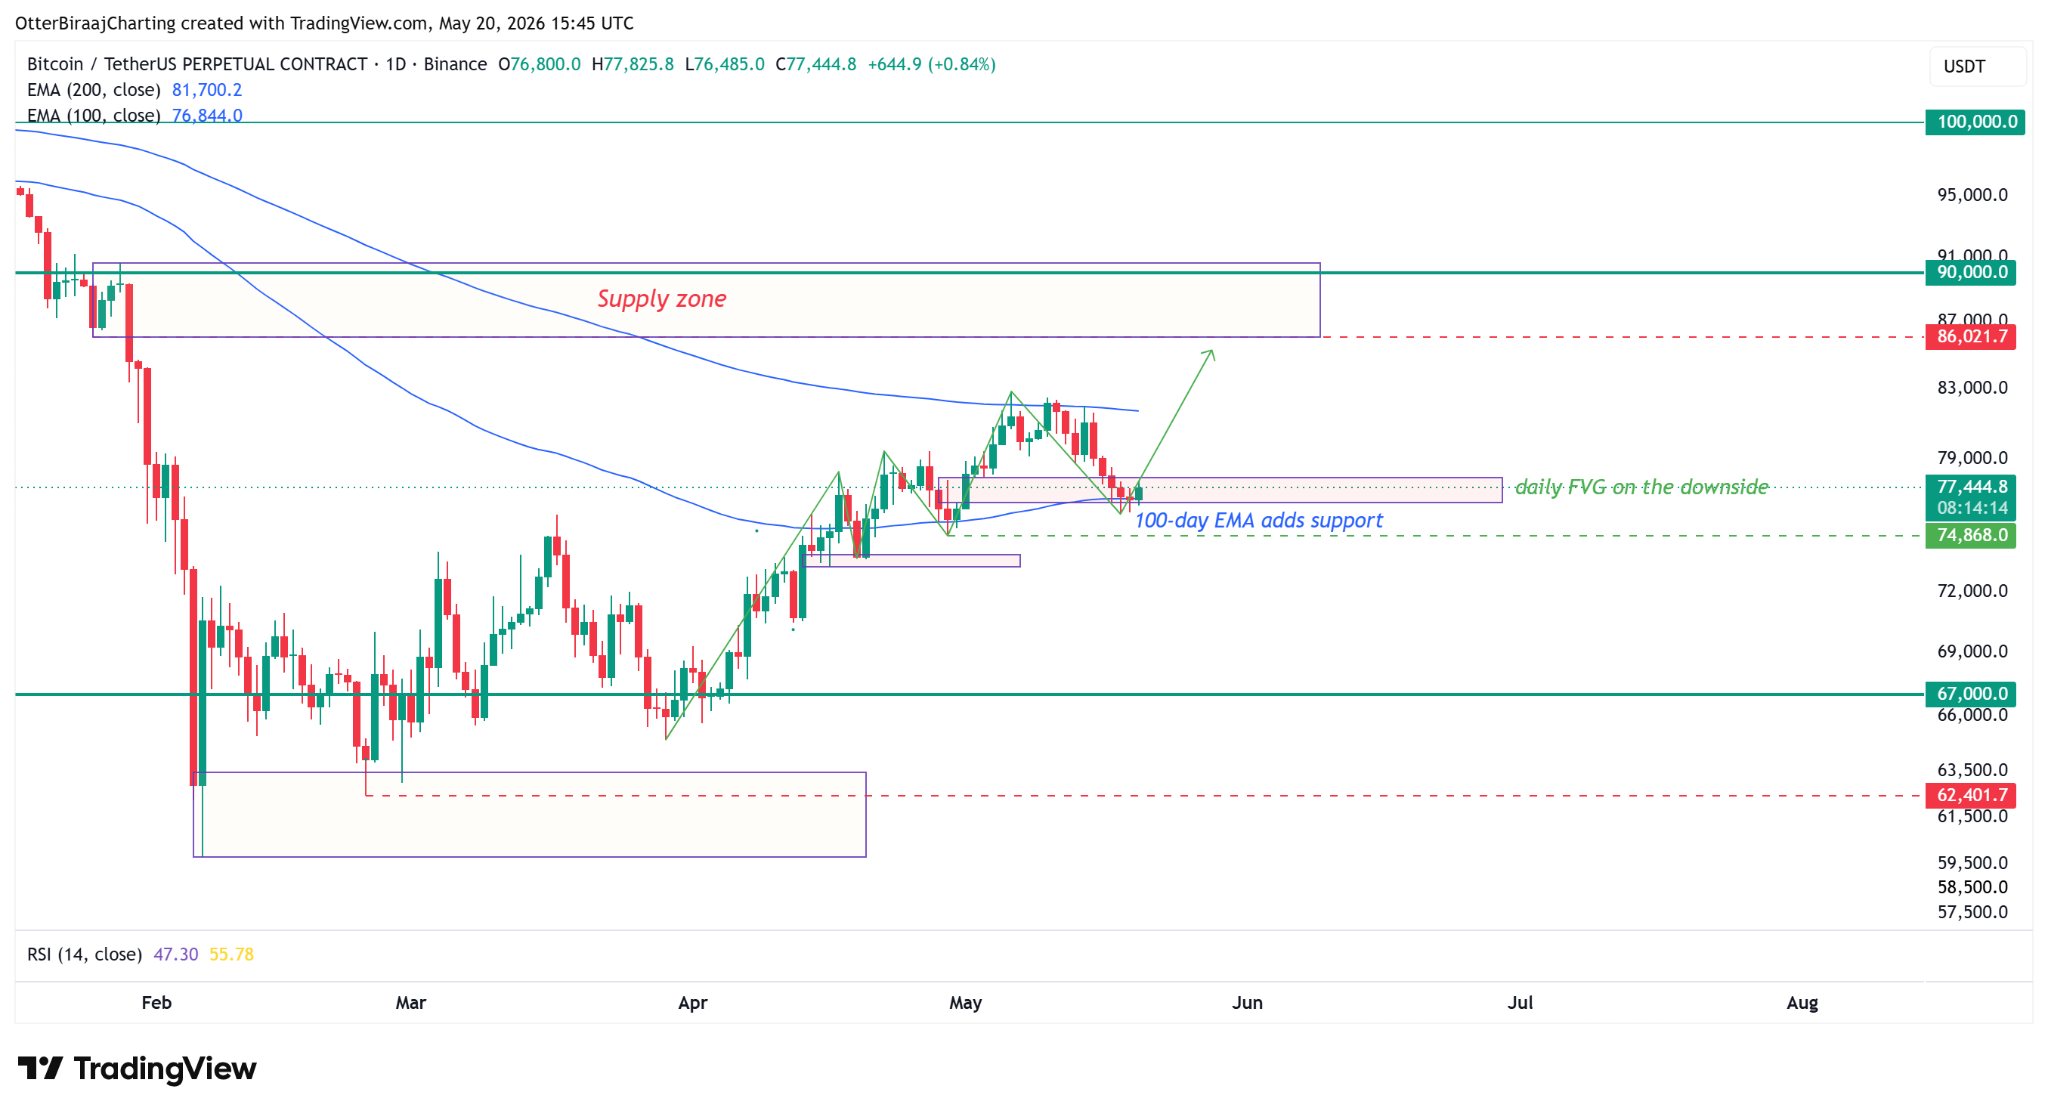
BTC/USDT, one-day chart. Source: Cointelegraph/TradingView
$74,800 remains a key level and a daily close below that price would mark the first bearish break in the current higher-low formation and shift focus to the $70,000 psychological support level.
Futures data continues to support demand resilience. Market analyst CryptoOnChain reported that Bitcoin’s 30-day moving-average net taker volume dropped to $58 million on May 18 from $243 million in April. However, the metric remained positive during the recent correction, indicating that BTC futures buyers continued to absorb sell pressure near the current price.
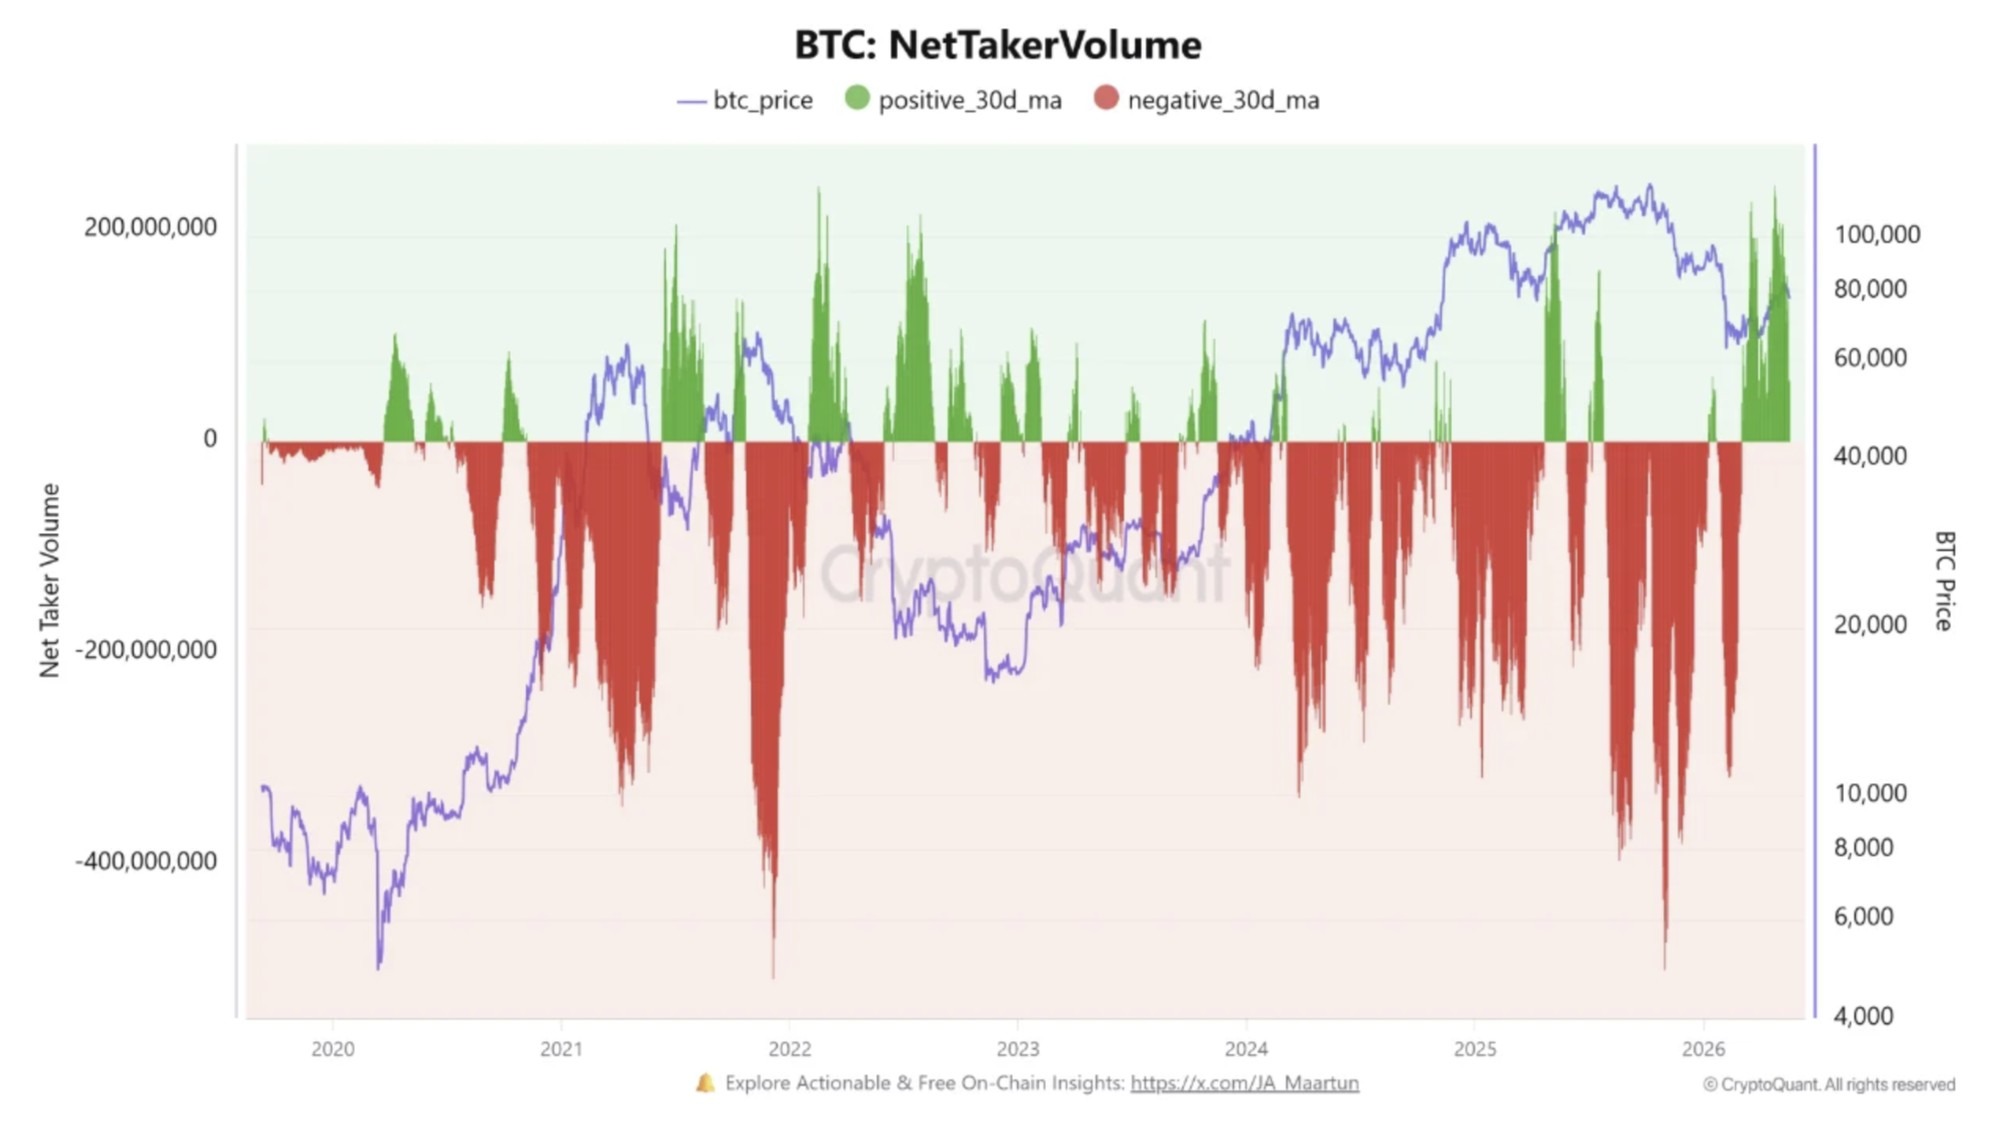
BTC net taker volume. Source: CryptoQuant
Related: Bitcoin sees fresh US sell-off as markets await Nvidia ‘biggest earnings event’

Bitcoin flipped a small but notable technical switch this week when the Coinbase premium moved back above zero, ending a run of negative readings that began after heavy selling on February 6.
According to market data published on February 23, 2026, Bitcoin was trading around $66,150 on Binance futures at one point, showing a brief hourly uptick of 0.40%.
Yet other spot indexes told a different slice of the story: CoinMarketCap listed BTC near $65,070 and flagged a roughly 3% drop for the day.
Those gaps are normal: futures, spot feeds, and aggregate trackers can diverge. What matters here is the premium’s direction — it had been negative for much of February and then crossed into positive territory.
Coinbase Bitcoin Premium has flipped positive for the first time since the Feb 6th bottom.
It looks like institutions are done with selling for now. pic.twitter.com/rUYgxO2Fo8
— Ted (@TedPillows) February 23, 2026
Coinbase is widely used by big US buyers, so a positive premium is read by many traders as a hint that domestic spot demand is outpacing offshore pressure.
But a flip above zero is only a starting signal. The size of the spread, how long it holds, and whether exchange inflows back up the move are the things that turn a signal into a trend.
Small, short-lived flips can be caused by temporary liquidity differences or quick arbitrage trades. Larger, sustained spreads are the ones that tend to matter to portfolio managers.
Market watchers are also pointing to broader factors. Rising tensions between the US and Iran, along with talk about tariff adjustments linked to US President Donald Trump, have driven investors toward safer assets in recent sessions.
That mood has at times pushed BTC below important technical cushions near $65,000, and some sessions saw brief dips under $64,000 before a few calm windows allowed minor rebounds. When fear spikes, crypto often feels it first.
Futures activity on Binance and other platforms stayed busy, even if volume didn’t show the sort of surge that precedes big breakouts. Reports put daily trading volume near $45.71 billion while market cap sat close to $1.30 trillion.
Funding rates, open interest, and exchange inflows are being monitored closely; each can either confirm or undercut the message from the Coinbase premium. A rising open interest that aligns with a growing premium would be more persuasive than a lone spread tick.
A Coinbase premium turning positive offers a hopeful signal after weeks below zero, but it doesn’t confirm a sustained rally. Investors will be tracking how large the spread is, whether Coinbase sees significant inflows, and if funding rates and open interest support the move. Traders are likely to wait through the next sessions for clear signs before considering the market stabilized.
Featured image from Gemini, chart from TradingView

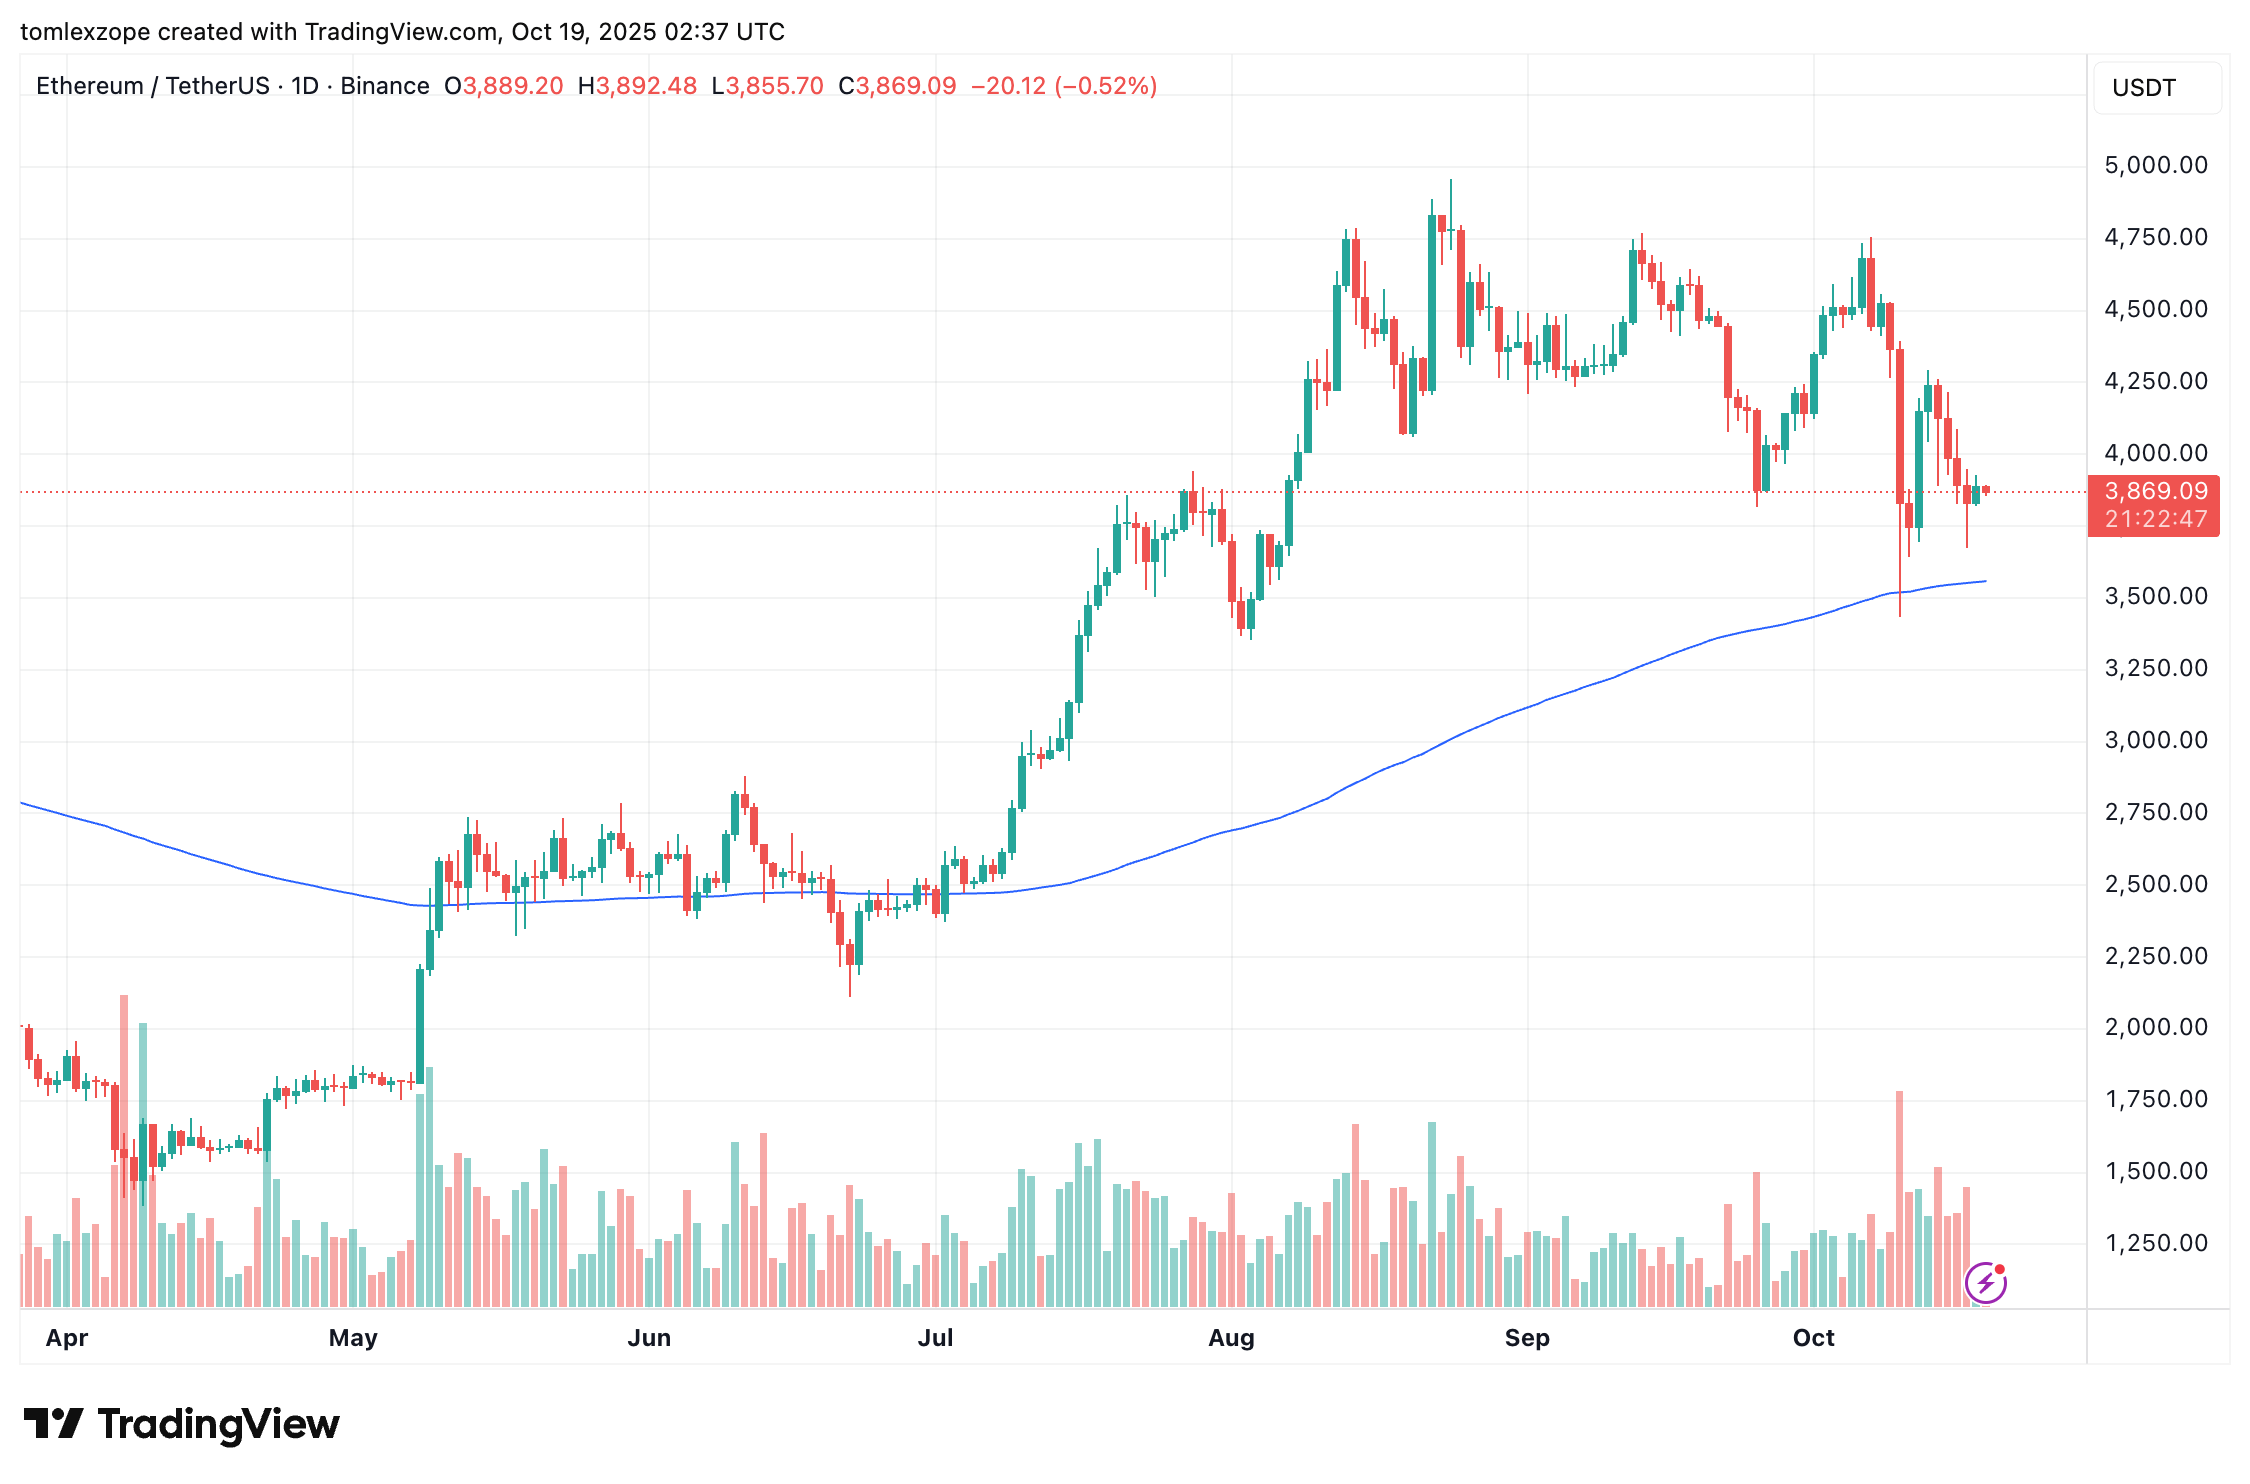
The price of Ethereum appears to be recovering nicely over the weekend after a period of investor uncertainty. The “king of altcoins”, following what looked like an aggressive return above the $4,200 level earlier this week, is now lagging under the psychological $4,000 mark.
While the Ethereum price has been building some positive momentum over the past day, the shadows of the October 10 downturn still seem to be weighing on investor sentiment. A market phenomenon known as the “Kimchi Premium” suggests a few tedious weeks ahead for the second-largest cryptocurrency.
In a recent post on the social media platform X, market analyst CryptoOnchain revealed that the Kimchi Premium has been on the rise over the past weeks. This observation is based on the movement of the on-chain indicator Korea Premium Index, which measures the price difference between South Korean exchanges and other global exchanges.
This metric, or the “Kimchi Premium,” shows how much extra Korean traders are willing to pay for a particular cryptocurrency (Ethereum, in this case). When the index is positive, it means that Korean retailers are willing to pay a premium for the crypto assets. Meanwhile, a negative Korean Premium Index signals that the retailers are only willing to buy the cryptocurrency at a discount.
According to CryptoOnchain, the Korea Premium Index for Ethereum recently saw a notable surge to around 8.2%, its second-highest level this year. The market analyst noted that this level of Kimchi Premium is a troubling sign, as it historically suggests extreme retail FOMO (Fear of Missing Out) and a potential price top.
Typically, whales tend to take advantage of the price gap by selling on Korean exchanges when the Korea Premium Index is on the rise. Due to increased selling pressure, the Ethereum price now faces a greater risk of correction.
For instance, the last time ETH saw a Kimchi Premium this high was in January, coinciding with the price fall to around $1,500. With this in mind, investors might want to tread with caution, as the odds of a sustained downward trend are significantly higher.
As of this writing, the price of ETH stands at around $3,875, reflecting no significant change in the past 24 hours. In what was expected to be a bullish period for the cryptocurrency market, “Uptober” has not particularly lived up to the expectations of investors. After a positive start to the month, the Ethereum price is currently down by almost 10%.

Key takeaways:
The Bitcoin Coinbase Premium flipped red as BTC price dropped below $104,000.
Bitcoin’s RSI hit its lowest point since April, hinting at a potential bottom zone.
The 200-day EMA support remained crucial as BTC risks short-term capitulation.
Bitcoin (BTC) extended its recent decline on Friday, slipping to $103,500 and triggering a notable shift in onchain market sentiment. The Bitcoin Coinbase Premium Index, which tracks the price difference between BTC on Coinbase and other exchanges, flipped red on the hourly chart for the first time in weeks.
Earlier this week, BTC attempted to find support around $110,000, buoyed by steady spot demand from US investors. The Coinbase premium even spiked to 0.18, its highest reading since March 2024.
However, as the price failed to hold above $110,000 on Thursday, that short-term confidence faded. While the hourly premium has turned negative, the daily reading remained slightly positive, indicating that long-term US buying support hasn’t fully disappeared, but it is currently under strain.
Adding to the bearish pressure, Bitcoin’s taker sell volume surged above $4 billion, signaling a wave of market sell orders. The move coincided with BTC’s rejection near the short-term holder (STH) realized price at $112,370, a key level that now acted as resistance.
Historically, this level marked the average cost basis for recent buyers, meaning that sustained rejection below it could accelerate short-term capitulation toward $100,000.

Related: Bitcoin holds $105K as US bank stocks recover, Trump truce lifts sentiment
BTC’s current price action closely resembles the March–April bottom range, when sharp intra-day wicks cleared out liquidity built over 30 days before a gradual recovery began. The pattern suggested that BTC could retest the $100,000 range without necessarily breaking the broader bullish structure, unless it falls decisively below that level.

The relative strength index or RSI also dropped to its lowest level, matching April’s low value of 34, following which BTC started to recover in the charts.
A key technical signal to watch is the 200-day exponential moving average (EMAs), which BTC has held for nearly six months. In the previous cycle, it maintained this trend from October 2024 to March 2024 before briefly losing it during consolidation. This time, the trendline has held from April to October 2025, with the price possibly losing the trendline in the coming days.
If BTC continues to follow its prior fractal, the market may enter a consolidation phase lasting several weeks. In Q1, the recovery phase extended nearly 45–55 days, forming a true bottom only in late April. Applying the same timeline suggests that a gradual recovery may not materialize until late November or early December.
Crypto trader Dentoshi echoed this view and said,
“$BTC has consistently bottomed around the 3-day 100 EMA this bull run—but it’s taken 45–96 days to do so.”

Related: Bitcoin ‘bull run is over,’ traders say, with 50% BTC price crash warning
This article does not contain investment advice or recommendations. Every investment and trading move involves risk, and readers should conduct their own research when making a decision.


