Blockchain data reviewed by CoinDesk shows wallets tied to North Korea’s Lazarus Group sold more than $30 million in bitcoin on the platform in the last three weeks alone.
Hyperliquid
The contracts traded just 1.6% apart on average when both markets were active, and traded near $92 and $94 most recently, translating to a more than 300% upside from the IPO price.
That fourfold premium also means Unitree could have a blockbuster debut and still leave leveraged bulls nursing steep losses.
“Unitree can open at twice its IPO price and still liquidate a third of long exposure,” Allium said.
An opening around $45, double the IPO price, would still be about 52% below the current perp price and could liquidate roughly 33% of long exposure, the analysts said. At the other extreme, a $128 opening price (nearly 6x from the IPO price) could liquidate an estimated 53% of the short positions, the report said. If shares open at around where the perps trade, nothing moves, and neither side is liquidated.
Positioning on Trade.xyz, the bigger market of the two, is almost evenly split, with $6.5 million long and $6.6 million short. However, smaller traders are more bearish: bets below $50,000 are 70% short by value.
“Any open away from today’s price forces one side of this market out,” Allium said.
Read more: Hyperliquid is taking crypto perps deep into DeFi’s ‘money LEGO’ land
Inside the brutal 2-minute flash crash sending a $400M South Korean market plunging on Hyperliquid
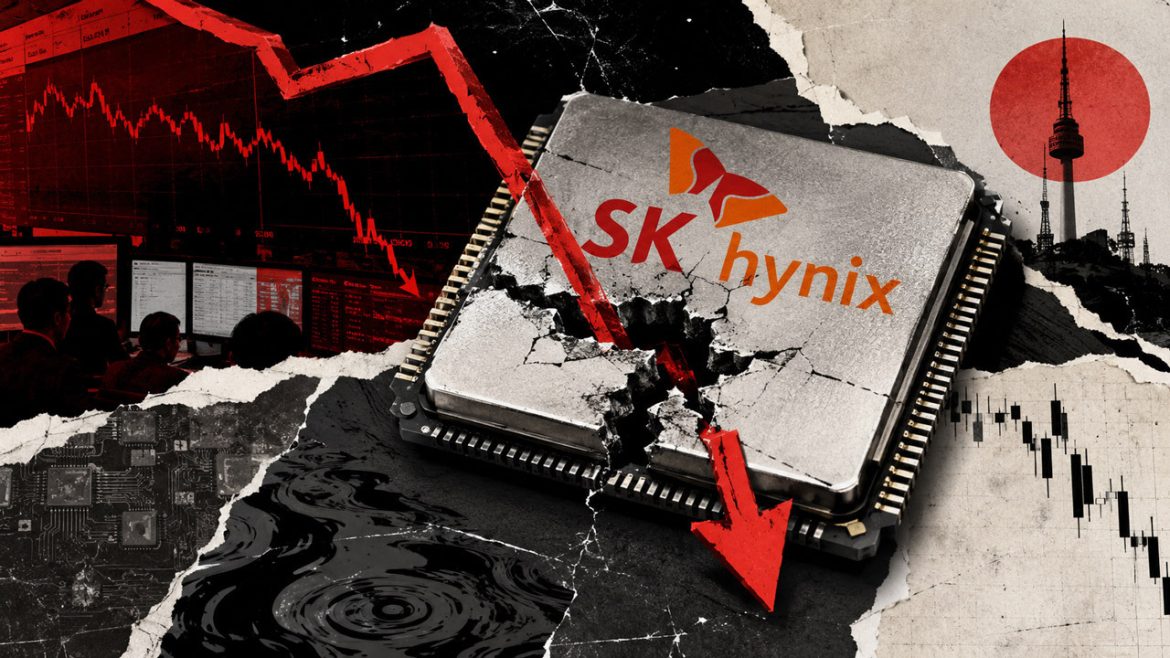
A two-minute price shock in a Hyperliquid market tied to South Korea’s SK Hynix has put the mechanics and oversight of equity-linked perpetuals under scrutiny.
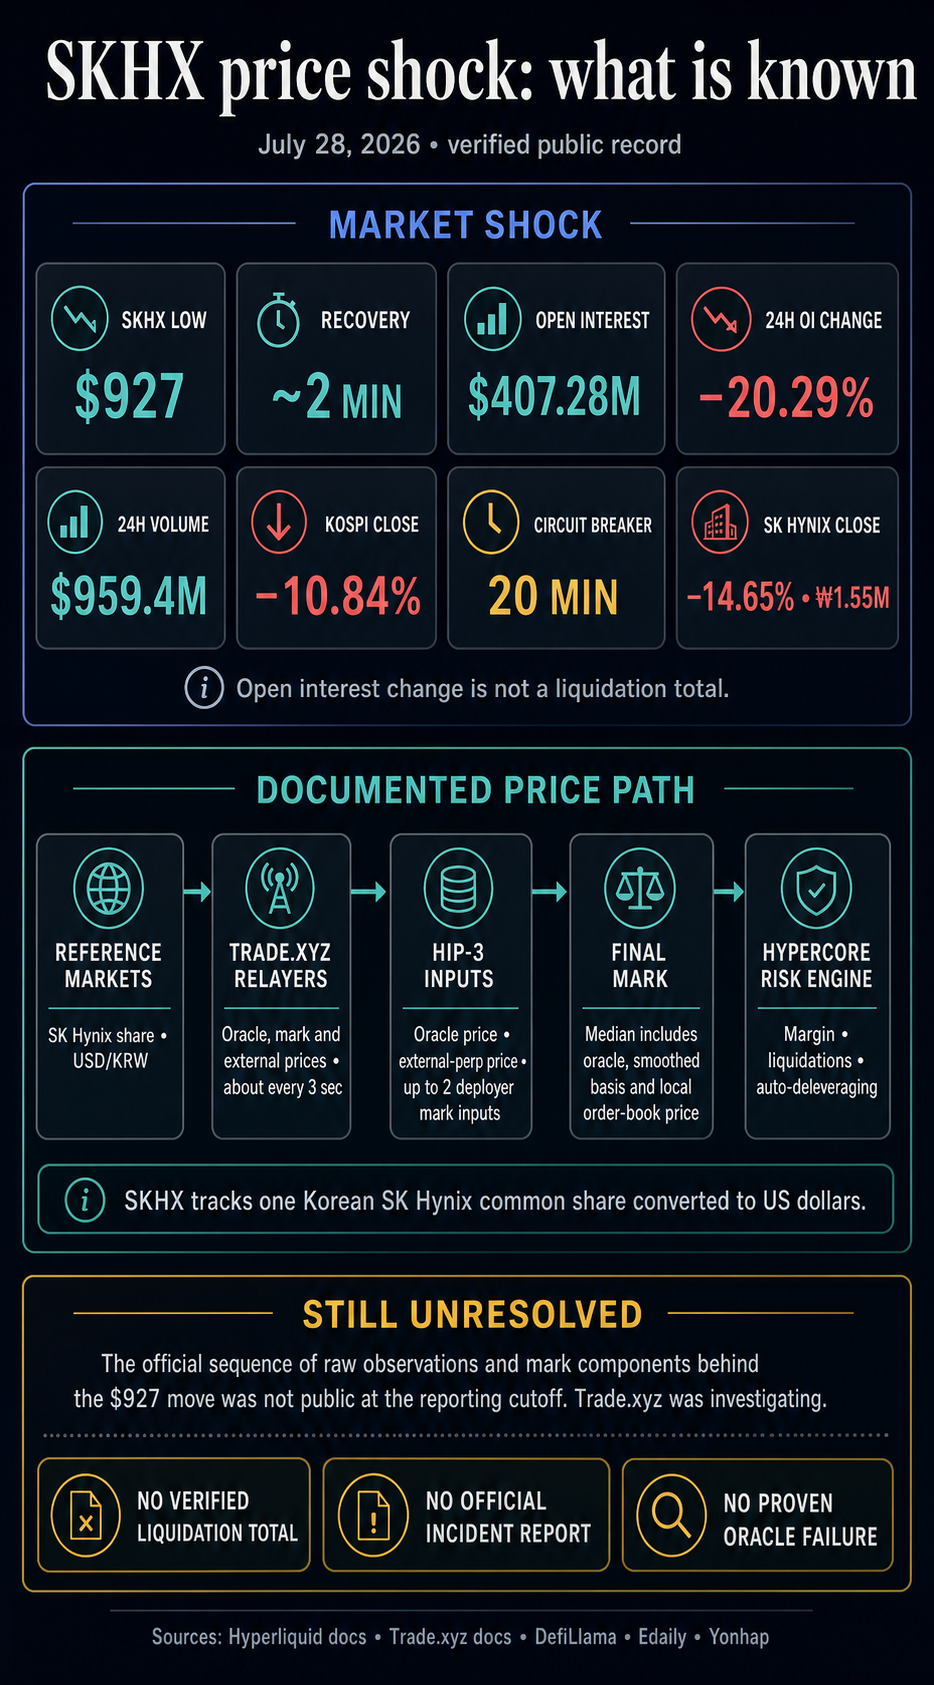
SKHX, a TradeXYZ-operated perpetual on Hyperliquid that tracks the US dollar value of one Korean SK Hynix share, briefly sank to $927 during South Korea’s pre-market window before recovering within roughly two minutes, according to local media.
A later DefiLlama snapshot put open interest at $407 million, down 20% over 24 hours, while 24-hour trading volume reached $959 million. Open interest measures the rolling value of outstanding positions, incorporating changes in both position size and price.
The underlying market was already under severe pressure. South Korea’s KOSPI closed 10.84% lower after a 20-minute marketwide circuit breaker, while SK Hynix’s Korean shares finished down 14.65% at 1.55 million won, Yonhap reported.
TradeXYZ’s contract specification defines SKHX as the dollar value of one SK Hynix common share, calculated by converting the Korean share price at the prevailing USD/KRW rate. TradeXYZ documents an external-pricing window from 8:00 a.m. to 8:50 a.m. Korean time. SKHX is separate from the company’s US-listed depositary receipt and from tokenized shares.


SpaceX IPO betting on Hyperliquid values Elon Musk’s company above $2 trillion even before SEC filing
Hyperliquid’s SPCX contract gives traders synthetic exposure to SpaceX before an IPO, turning private-market expectations into a live crypto derivatives price.
May 18, 2026 · Oluwapelumi Adejumo
From price input to liquidation
Hyperliquid’s HIP-3 specification gives a market deployer control over its oracle definition, oracle prices, leverage limits and settlement. The deployed market uses HyperCore’s order books and margin system.


Anyone can now create Hyperliquid perp contracts with $20M: Is DeFi about to break?
Listing anything is easy; risk and liquidity are hard, and here’s the model.Hyperliquid’s HIP-3 removes gatekeepers by letting anyone launch perpetuals if they stake $20 million. It’s either DeFi’s boldest safety experiment, or its next stress test.
Oct 15, 2025 · Gino Matos
TradeXYZ says its relayers compute and transmit the XYZ market’s oracle, mark and external prices about every three seconds. HyperCore handles matching, margining, liquidations and auto-deleveraging. In the documented design, TradeXYZ supplies the bespoke price inputs and HyperCore applies its risk machinery to the resulting mark.
Daily signals, zero noise.
Market-moving headlines and context delivered every morning in one tight read.
5-minute digest 100k+ readers
Free. No spam. Unsubscribe any time.
Whoops, looks like there was a problem. Please try again.
You’re subscribed. Welcome aboard.
The HIP-3 deployer API accepts an oracle price, an external-perpetual price and as many as two deployer-supplied mark-price inputs. HyperCore contributes a local price derived from the best bid, best offer and latest trade. TradeXYZ says the final mark is the median of the oracle, a smoothed oracle-to-market difference, and that local order-book price.


Crypto just opened S&P 500 trading for the weekend while Wall Street shuts down
Trade[XYZ] launched a licensed S&P 500 perpetual for non US investors, testing who prints the first trusted weekend price.
Mar 19, 2026 · Gino Matos
The rulebook shows how SKHX pricing is meant to work. The plunge to $927 is still a black box, with the raw observations and mark-price ingredients absent from the public record. DefiLlama names Pyth Lazer as the oracle provider. TradeXYZ says its relayer and updater carry prices into HyperCore. The incident-level handoff between those systems remains the missing piece.
BlockMedia reported at 18:41 Korean time that Hyperliquid said TradeXYZ was investigating and planned an update after reaching a conclusion. At that cutoff, the reviewed sources contained no official incident report or event-specific account of compensation, insurance impact, a halt, a cap change, or slashing.
HIP-3’s allocation of controls is clear even as responsibility for this price shock remains open: the deployer operates the oracle settings, and HyperCore executes the market and risk functions. TradeXYZ’s findings will determine whether the episode reflected the published design under extreme conditions or a price-feed safeguard that needs revision.
Stocks Just Topped Crypto on Hyperliquid. ARK Says That Changes Everything
In brief
- Real-world assets (RWAs)—tokenized versions of traditional financial instruments like company stocks, crude oil, and market indices traded as blockchain contracts—accounted for 54% of Hyperliquid’s weekly trading volume during July 13–19, the first time non-crypto assets have dominated the exchange.
- ARK Invest’s director of digital assets research Lorenzo Valente said Hyperliquid’s $26 billion in RWA trading last week surpassed the combined crypto perpetual volume of every other decentralized exchange on earth.
- South Korean chipmaker SK Hynix—a direct rival to Samsung in AI memory production—drove most of the interest on Hyperliquid’s third-party market platform.
For the first time, traders on Hyperliquid moved more money through stocks and commodities than through crypto. Lorenzo Valente, director of digital assets research at ARK Invest, announced the milestone Thursday on X: “We are entering a new era for DeFi.” Hyperliquid, he said, had for the first time generated more trading volume from so-called real-world assets, or RWAs, than from crypto in a single week.
RWAs—meaning tokenized versions of traditional financial instruments like company shares, crude oil, or the S&P 500, converted into blockchain-based contracts that traders can buy and sell around the clock—totaled $25.1 billion during July 13–19, or 52% of Hyperliquid’s $48.2 billion in weekly volume, per Blockworks data. Valente put the latest running figure at $26 billion and 54%.
The context makes that number land harder. Total perpetual DEX volume across the industry last week was $79 billion. Hyperliquid processed $50 billion of it. The $26 billion in RWA trading alone—just the stock bets, the oil contracts, the index plays—was larger than the combined crypto perpetual volume of every other decentralized exchange on the market.
How stocks ended up on a crypto exchange
The mechanism behind this is HIP-3, a framework Hyperliquid launched in October 2025 that lets outside teams build their own perpetual markets—contracts that track an asset’s price with no expiry date, letting traders bet on it going up or down with borrowed money—using Hyperliquid’s existing infrastructure. Builders stake 500,000 HYPE tokens, currently worth roughly $30 million, to access the system.
We are entering a new era for DeFi.
For the first time ever, @HyperliquidX generated more volume from RWAs than crypto in a single week. RWAs accounted for 54% of total trading volume.
An even more interesting trend: since June, single stocks have overtaken indices and… pic.twitter.com/INbfCwc5pJ
— Lorenzo Valente (@LorenzoARK) July 23, 2026
Since June, individual stocks have overtaken indices and commodities inside HIP-3, with single-stock perpetuals now making up 61% of all RWA trading. The HIP-3 platform has already hosted pre-IPO markets for SpaceX, Anthropic, and OpenAI. “RWAs accounted for 54% of total trading volume,” Valente noted.
The most-traded stock is SK Hynix, the South Korean memory chipmaker that competes with Samsung in supplying DRAM and high-bandwidth memory for AI systems.
ARK’s interest in Hyperliquid goes back further. In September 2025, CEO Cathie Wood told the Master Investor podcast that the platform “reminds me of Solana in the earlier days,” adding that Solana had proven its worth and earned its place with the biggest names in crypto. She called Hyperliquid “the new kid on the block,” and ARK has not confirmed any position since.
Now one of ARK’s own analysts is raising a harder question for the whole industry. “I’m no longer convinced RWA trading will naturally aggregate on the same venue as crypto,” Valente wrote, predicting that dedicated category leaders may emerge within RWA—and that a platform’s grip on Bitcoin and Ethereum flow may prove “far less important than many people assume.”
Traders still focused only on crypto tokens, he added, “are focusing on the wrong market.”
Daily Debrief Newsletter
Start every day with the top news stories right now, plus original features, a podcast, videos and more.
Why viral public whale liquidations are becoming a real trading signal on Hyperliquid
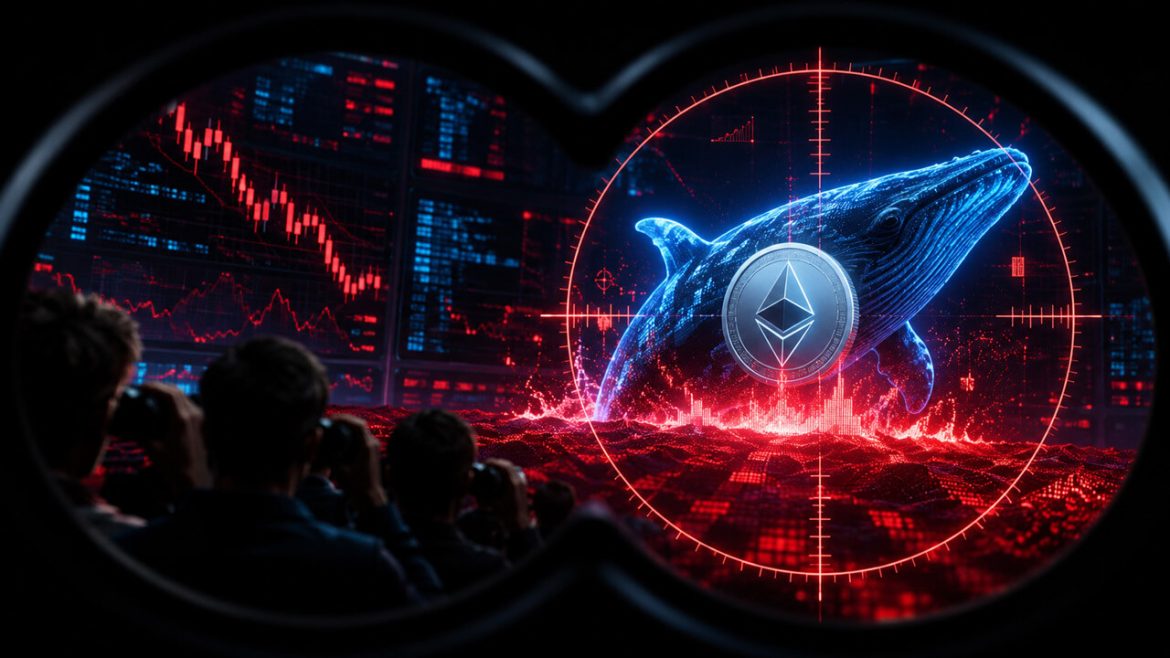
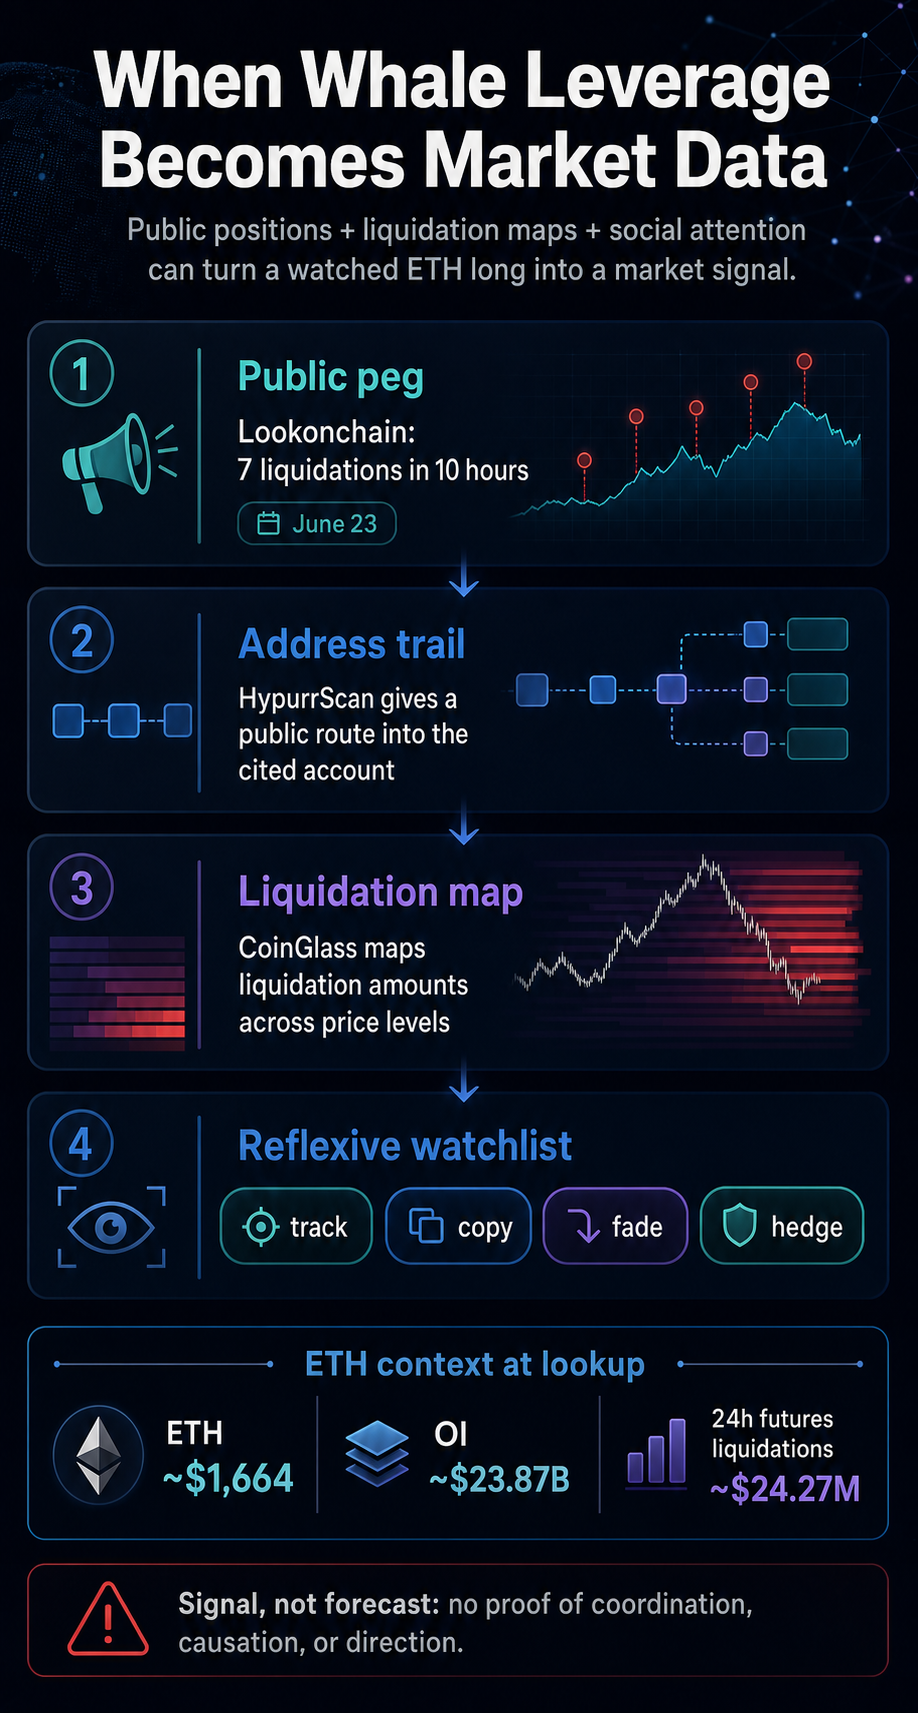
A highly watched Hyperliquid ETH long has become a public stress point for traders tracking whale leverage in real time. On June 23, Lookonchain said the account it identified as Machi Big Brother was liquidated 7 times over 10 hours while still holding long positions.
Seven forced exits in one 10-hour window would usually be a trader-specific blowup. On Hyperliquid, the public address route, liquidation maps, and social attention can all point the market toward the same vulnerable price zone.
In that sort of setup, the whale becomes both a trader and a data point.

We’re currently experiencing a liquid but unsettled ETH market. CryptoSlate’s Ethereum market page showed ETH at $1,607 on June 24, down 3% over 24 hours, with a market cap near $194 billion and a 24-hour volume near $13.5 billion.
CoinGlass’s ETH derivatives page also shows open interest near $22.7 billion and 24-hour futures liquidations near $213 million as of press time. Those figures suggest correlation rather than causation, and they explain how a visible liquidation level becomes a focal point in a market where leverage, attention, and price can react to one another.
Why visible leverage on Hyperliquid changes the setup
Hyperliquid is one of the clearest venues for tracking large perp traders because account-level activity can be analyzed alongside market data tools. The HypurrScan address page cited in connection with the Lookonchain claim provides a public entry point.
CoinGlass’ Hyperliquid liquidation map presents liquidation amounts and price distributions across levels. That turns forced-exit risk into something traders can watch in advance, not only something they read about after a cascade.


Hyperliquid hit by $4 million loss after whale’s high-risk trading incident
Hyperliquid manages leverage limits after high-risk trader loss impacts market dynamics.
Mar 12, 2025 · Oluwapelumi Adejumo
The mechanism is simple. A leveraged long has a price where the position can be forced out. If that level is visible, other traders can monitor it.
If enough traders monitor it, the level can attract more attention than it would have if the position stayed private. Some traders may use it as a risk marker. Others may try to fade the crowd or copy the same direction until the position becomes part of a public narrative.
None of that requires a conspiracy. It only requires a shared screen.
The public aspect also changes the meaning of speed. A liquidation level that once belonged mainly to the trader and the venue can now circulate through dashboards, screenshots, X posts, and chat rooms before the price gets there.


CZ called Hyperliquid’s no KYC model “awesome” – Then mentioned lawyers
CZ praised the product, but his Galaxy remarks put the access model at the center of the next regulatory fight.
Jun 24, 2026 · Liam ‘Akiba’ Wright
The result is a faster feedback loop in which more traders can decide whether the level is a warning, an opportunity, or noise.
That makes the position useful even to traders who never intend to follow it. A watched liquidation band can serve as a reference for stop placement, hedging, and risk reduction, yet it offers no guarantee that the price will touch that level.
The public value is the shared visibility, not any promise of direction.
The Hyperliquid signal still has limits
Public whale watching offers some relevant signals, but it’s usually a poor forecast. A visible liquidation zone can tell traders where pressure may build. It leaves open whether the price will move there, whether the whale will add margin, whether the position will be closed, or whether the crowd is already leaning too far in one direction.
Daily signals, zero noise.
Market-moving headlines and context delivered every morning in one tight read.
5-minute digest 100k+ readers
Free. No spam. Unsubscribe any time.
Whoops, looks like there was a problem. Please try again.
You’re subscribed. Welcome aboard.
That is why the Machi episode works best as live market data rather than a celebrity-trader spectacle. It resurfaces the question of whether the public tracking of high-leverage accounts is changing how traders form short-term expectations on Hyperliquid.
CryptoSlate has covered related Hyperliquid and liquidation-map episodes from different angles. A March 2025 Hyperliquid incident demonstrated how a high-risk whale trade could lead to venue-level losses.
A June 2025 Bitcoin whale loss on Hyperliquid showed how large leveraged positions can turn specific price levels into public drama. For further reading, we’ve also covered how liquidation heatmaps can identify volatility zones before prices get there.


Hyperliquid Bitcoin whale loses $100 million as BTC price falls below $105K
Hyperliquid Bitcoin whale James Wynn lost $100 million as the BTC price dropped, highlighting the risks of high-leverage crypto trading.
Jun 1, 2025 · Christina Comben
This is recurring behavior: traders watch more than price. They watch who can be forced to sell, where that forced selling might happen, and how many other people are watching the same level.
| Visible signal | What it can show | Limits |
|---|---|---|
| Lookonchain liquidation post | A public claim that the account was repeatedly liquidated while still long ETH | Trader motive, identity beyond attribution, or future behavior |
| HypurrScan address route | A public place to inspect the account path cited in connection with the claim | A static current position unless the page is refreshed at publication |
| CoinGlass liquidation map | Price zones where liquidation amounts cluster | Trader coordination or certainty that price must reach a level |
| Social attention | Whether a position is becoming part of the public trading conversation | Causation between attention and liquidation |
What to watch next
The most useful signal going forward is whether public data continues to change traders’ behavior.
If the account reduces exposure, adds margin, or disappears from the discussion, the episode may remain a short-lived trading spectacle. If ETH trades toward visible liquidation clusters while the address remains widely watched, the setup becomes a clearer example of reflexive pressure, without proving coordination, causation, or direction.
That feedback loop is why public perp positions feel different from older whale-watching habits. A wallet transfer can hint at intent. A liquidation map tied to a watched perp position can show a possible trigger.
Once that trigger is shared across market dashboards and social feeds, the position becomes a reference point for risk managers, momentum traders, and spectators alike.
The risk is overstating what the data can say. Public liquidation levels alone fall short of a trading plan and do not make ETH’s next move predictable. They do, however, change the information environment around a large position.
So the TL;DR is basically, public Hyperliquid whale positions are becoming a market signal when they combine address visibility, liquidation maps, and social attention. The signal offers no promise about direction. It is a visible weak point that traders can see, discuss, and trade around before the next liquidation headline arrives.
Wallet V Launches Public Performance Benchmark For AI Trading Agents On Hyperliquid And Aster
Road Town, British Virgin Islands, June 15th, 2026, Chainwire
Wallet V, a self-custody Web3 wallet, launched a public performance benchmark for the AI trading agents that its users have configured on the third-party decentralized derivatives platforms Hyperliquid and Aster. The benchmark publishes aggregate cohort performance and is hosted on the Wallet V website.
The benchmark covers 688 agents created by Wallet V users over the prior two months. Each agent was configured by the user, used a large language model selected by the user to generate trading decisions, and executed on Hyperliquid or Aster. Wallet V aggregates the on-platform performance of those agents by underlying model. Performance is refreshed as new agents are deployed.
The cohort spans seven large language model families. Across the cohort, 42 percent of agents recorded a profit and loss balance of zero or higher over the period. Peak agent-level return on investment in the dataset ranged from negative 30 percent on the lowest-performing model to positive 307 percent on the highest. Models represented by fewer than 10 agents in the cohort are reported as directional rather than statistically conclusive.
Agents in the cohort executed strategies as perpetual futures across four asset classes available on Hyperliquid and Aster. These include major digital assets such as BTC, ETH, and SOL; equities, including pre-initial public offering equity exposure; commodities including gold, silver, and oil benchmarks; and major foreign exchange pairs. All instruments are accessed through third-party venues.
“At Wallet V, the focus has been on building infrastructure for the next phase of crypto. This benchmark is what that next phase looks like up close. Users now decide which AI model to configure their agent in the same way institutions evaluate managers, by reviewing observable performance over time,” said Adam Cai, Founder & CEO of Virgo Group.
Wallet V plans to extend the benchmark in subsequent releases. Future releases include the addition of newer model families, support for prediction markets, advanced analytics features for copilot trading and personalized AI prompt generation tailored to each user’s trading style.
The Wallet V applications for iOS and Android are available at dl.walletv.io.
About Wallet V
Wallet V is a Web3 self-custody wallet that gives users access to third-party AI models to configure AI agents and execute user-defined trading strategies. The application connects to third-party platforms supporting cross-chain swaps, perpetual futures, prediction markets, and onchain exposure to tokenized equities.
Wallet V is an incubation project by Virgo Group, a digital asset service provider led by CEO Adam Cai. Virgo Group is backed by investors including Draper Dragon, OKX Ventures, Vaulta Foundation, Cobo Ventures, Waterdrip Capital, and Sora Ventures.
Disclaimer
Trading crypto, perpetual contracts, tokenized assets, and prediction markets involves significant risk of loss and is offered by third-party platforms. Wallet V is a software provider that connects to external platforms and does not offer trading services or AI automation tools directly or indirectly. Wallet V does not provide investment, tax, or legal advice. Access to certain products may be restricted in some jurisdictions.
Contact
Peter Ip
marketing@walletv.io
The Hyperliquid Policy Center disputed the framing.
CME Group and Intercontinental Exchange (ICE), the parent company of the New York Stock Exchange, are lobbying the CFTC and U.S. lawmakers to impose federal oversight on Hyperliquid, Bloomberg reported Friday.
The exchanges cited concerns that the platform’s largely offshore, lightly regulated trading environment could be vulnerable to market manipulation and sanctions evasion.
The exchanges argue that Hyperliquid’s growing trading volumes in crypto and commodity-linked markets could begin to distort price discovery in critical sectors like oil, where global benchmarks are formed, warning that anonymous trading environments may allow insiders or state-linked participants to influence prices. Their ask: registration with the CFTC, which would require the platform to implement customer identification programs and trade surveillance measures.
HYPE declined about 6% following the news, dropping from above $45 to below $43.
The lobbying push carries an obvious competitive dimension. CME is advancing plans to expand its own 24/7 crypto trading offerings, with Bitcoin Volatility Futures scheduled to begin trading June 1 and Nasdaq CME Crypto Index Futures — covering BTC, ETH, XRP, and others — launching June 8.
Hyperliquid Pushes Back
The Hyperliquid Policy Center, an advocacy group formed in February by a Hyperliquid-affiliated foundation, disputed the framing in a post on X Friday. The group called the CME/NYSE characterization inaccurate, arguing that traditional exchange operators — which match buyers and sellers and collect fees — operate fundamentally differently from Hyperliquid’s model, and that conflating the two misrepresents the platform’s structure and risk profile.
The Policy Center has already been engaging with the CFTC in meetings aimed at establishing a legal route for U.S. participation in Hyperliquid’s markets. The group argues its markets are more beneficial and present fewer risks than traditional centralized exchanges, and expects the CFTC to develop a tailored regulatory framework for on-chain derivatives platforms.
Regulatory Vulnerability
Hyperliquid’s bridge, the single point of custody for all user funds, is secured by a 3-of-4 multisig. At its April 2025 high point, Hyperliquid accounted for roughly 70% of the on-chain perpetual futures market.
That scale, combined with its relatively centralized custody structure and IP-based geo-restrictions, could heighten regulatory risk.
Key takeaways:
- A whale linked to asset manager Fasanara Capital holds a $38 million crypto short position, but will it impact Bitcoin’s price?
- Negative futures funding rates at Binance and Bybit point to unusual demand for bearish positioning despite BTC’s recent price gains.
Bitcoin (BTC) struggled to trade above $78,000 on Friday, but the overall setup remains bullish. BTC gained 29% since the $60,100 yearly low on Feb. 6, and many analysts believe it is on the verge of a longer-term breakout. At the same time, a bearish Bitcoin whale on Hyperliquid exchange has maintained a large short position. The whale has made $159 million in profits over the past seven months. Does its positioning provide any signal that the market should pay attention to?
Hyperliquid whale profit and loss data. Source: CoinGlass
The entity behind address 0x7fda…c517d1 (also known as BobbyBigSize) on Hyperliquid exchange excelled during the market crash between October to November 2025 by placing leveraged short bets on Ether (ETH), Hyperliquid (HYPE), Avalanche (AVAX), and Fartcoin, among others. The account has failed to sustain its gains, resulting in a $561,000 loss over the past 30 days.
The whale is bullish on ETH, but bearish on BTC and altcoins
Using algorithmic trading, the whale opened short-duration long positions in Bitcoin and Solana (SOL) in the past, resulting in a staggering $11 billion in trades on Hyperliquid exchange. BobbyBigSize currently holds $19.4 million in assets deposited on the platform. 63% of its trades result in positive outcomes, which is considered highly successful.

BobbyBigSize’s current positions, USD. Source: Hyperdash
Currently, BobbyBigSize holds a $38 million short position in BTC and multiple altcoins. The trader also opened a $21 million leveraged long ETH position last week, indicating short-term confidence. Generally, the portfolio positioning is bearish, suggesting an expectation of a short-term correction.
Related: Critical Bitcoin trend change in works, but analysts say daily close above $80K required
The average trade duration for BobbyBigSize has been slightly longer than two weeks, while the median position has lasted for less than four days, according to Hyperdash data. Arkham data previously linked this address to Fasanara Capital, a London-based institutional asset manager. The company reportedly manages over $5 billion in assets.

Source: X/Arkham
According to Fasanara Digital’s website, it launched in 2018 and manages $400 million across market-neutral strategies and venture investments. In parallel, a quantitative multi-manager approach in various liquid markets manages $150 million. However, the strategy behind the fund’s approach to cryptocurrency was not clearly specified.

Hyperliquid DEX annualized funding rates. Source: Hyperliquid.xyz
Funding rates for BTC and ETH stood slightly positive on Hyperliquid, indicating moderate demand for leveraged long positions. Under neutral circumstances, longs pay 6% to 12% annualized rates to maintain their positions. Currently, funding rates are negative on Binance and Bybit, signaling unusually high demand for bearish leverage.
Algorithmic traders are erratic and unpredictable, and losses by “BobbyBigSize” over the past couple of months evidence that no single trading strategy lasts indefinitely. However, this whale’s bearish positioning aligns with the increased demand for leveraged short positions; therefore, Bitcoin traders should not discard the possibility of a retest of the $75,000 level.
📊
No votes yet – Be the first to vote
HYPE jumps big. The token hit $36.9 yesterday, marking a solid 22% gain over the past month as futures traders pile into positions. Trading patterns look pretty bullish right now.
Hyperliquid’s chart shows what traders call a bullish flag – basically a pause before the next leg up. And there’s more. A golden cross formation is brewing, where the short-term moving average crosses above the long-term one. Market cap keeps climbing as more traders jump in expecting a breakout. Volume tells the story too. Futures contracts surged over recent weeks, showing serious interest from market participants who think something big is coming.
The golden cross thing matters. A lot.
Traders are watching this setup closely because it’s worked before in similar scenarios. When you see both the flag pattern and the golden cross lining up, that’s when things get interesting. The current price represents a major comeback from earlier this year, driven by positive sentiment and technical indicators that finally align. But traders stay nervous, waiting to see if the bullish flag actually delivers on its promise.
Technical Hurdles Ahead
Some analysts aren’t totally convinced yet. Hyperliquid faces resistance levels that could stop the rally cold. The broader crypto market environment will play a huge role in whether HYPE can sustain its momentum. Regulatory factors and market volatility remain wildcards that could derail the party.
For now though, spirits stay high. No major negative news has hit recently, and the token’s technical strength keeps drawing attention. Pending announcements from Hyperliquid’s development team might shake things up further, but the team hasn’t said much. No official comment or timeline exists regarding future updates or strategic partnerships.
Institutional money is moving in too. On March 28, crypto analytics firm Chainalysis reported that several large wallets – the kind institutions use – have been accumulating HYPE tokens. These big players are positioning themselves ahead of what they think is coming next.
Binance data shows HYPE’s trading pair with USDT jumped 35% in volume over the past week. That’s retail and institutional investors both piling in, eager to catch the potential upward move before it happens. Market participants tracking Bitcoin Surges Toward K as Whale will find additional context here.
Analyst Takes and Market Buzz
Jane Doe from Crypto Insights weighed in March 31, calling Hyperliquid’s bullish flag pattern one of the most convincing she’s seen lately. Her analysis points to resistance around $40 – if HYPE breaks through that level, bigger gains could follow.
The Hyperliquid team stays quiet about upcoming plans. As of April 1, no official statements exist regarding strategic moves or partnerships that might influence the token’s path. Traders should watch for any news releases that could shift market sentiment fast.
Kraken reported March 30 that new accounts trading Hyperliquid futures rose 40%. Retail traders are jumping in, looking to leverage potential price swings. But not everyone’s convinced the momentum will last.
Tom Andrews from Digital Asset Research warned April 1 that if Hyperliquid drops below its $35 support level, a short-term sell-off could hit despite the bullish technical signals. Things can shift fast in crypto.
Community speculation runs wild about potential partnerships. March 29 rumors on social media suggested a possible collaboration with a major DeFi platform. These claims remain unverified, but they’ve added fuel to the recent price action. Industry observers have noted parallels with Bitcoin Jumps Past K as Trump in recent weeks.
The upcoming weeks will determine whether Hyperliquid breaks past current resistance or consolidates before any further moves. Traders keep their eyes glued to charts, waiting for that golden cross to materialize and confirm what the bullish flag pattern seems to promise.
Derivatives markets paint a clearer picture of where smart money thinks HYPE is headed. Open interest in Hyperliquid futures contracts climbed 60% since mid-March, reaching $2.8 billion according to CoinGlass data from April 2. Funding rates turned positive across major exchanges, meaning long positions are paying shorts – a classic sign that traders expect prices to keep climbing. Deribit shows unusual activity in HYPE call options with strikes at $45 and $50, expiring in two weeks.
Market makers are positioning for volatility too. Several prominent crypto funds quietly increased their HYPE allocations in March, based on 13F filings that surfaced last week. Alameda Research’s successor fund and Jump Trading both appear on recent holder lists, though exact position sizes remain undisclosed. Meanwhile, whale tracking services detected three separate purchases exceeding $10 million worth of HYPE tokens between March 25-30, all from wallets linked to institutional custody providers.
Frequently Asked Questions
What price is Hyperliquid trading at now?
HYPE currently trades at $36.9, up 22% over the past month according to recent data.
What technical patterns are traders watching?
A bullish flag formation and potential golden cross are the main patterns driving current interest in HYPE.
Post Views: 9
Hyperliquid gold perps front-ran CME after Iran strikes and the Monday gap exposed a new weekend leader

On Feb. 28, coordinated strikes hit Iranian nuclear facilities while most benchmark commodity markets sat dark.
Traditional gold futures on CME’s COMEX exchange wouldn’t reopen until Sunday evening Central Time, leaving a 48-hour window where macro risk had nowhere obvious to express itself.
Except it did: on venues that never close.
By the time COMEX gold futures flickered back online Sunday at 5:00 PM CT, perpetual futures contracts tracking gold and silver on always-on derivatives platforms had already written the first draft of Monday’s gap.
Traders didn’t wait for permission. They repriced geopolitical risk in real time, using whichever venue accepted their orders, and when the benchmark finally opened, it caught up to a price that had been forming all weekend.

This isn’t a story about decentralized finance replacing traditional exchanges. It’s about continuity.
Markets exist to discover prices in the face of uncertainty. When benchmark futures close, the best tradable proxy becomes the weekend risk barometer. Always-on derivatives don’t need larger open interest than COMEX to matter. They need to be open, tradable, and informative under stress.
The advantage isn’t purity, but uptime.
Testing the weekend tape
What happened during that closure window offers a case study in how price discovery relocates when reference markets go dark.
Under normal weekday conditions, perpetual contracts trade on a structural basis relative to front-month futures.
Front-month contracts embed the cost of carry, and perpetuals track the spot price more closely through funding, which is the periodic payment between long and short positions that pins the perpetual price to the underlying.
A modest, persistent gap between the two is expected.
However, the weekend of the Iran strikes created an experiment. With COMEX futures offline from Friday’s 4:00 PM CT close until Sunday’s 5:00 PM reopen, gold and silver perpetuals on platforms like Hyperliquid and Binance became the only liquid venue for expressing macro risk in precious metals.
Both platforms list 24/7 perpetual contracts tied to gold and silver, giving traders continuous access to metals exposure.
Analyst Kunal Doshi measured what happened during peak volatility hours.
Hyperliquid’s gold and silver perpetuals are priced at a median premium of roughly 75 to 78 basis points above Binance’s equivalent contracts.


More importantly, when COMEX reopened, Hyperliquid’s weekend price sat closer to the first benchmark print than Binance’s tape by approximately 22 to 31 basis points.
The weekend market that led turned out to be the one that better predicted the gap.
Those measurements don’t prove causation, but they reveal something about microstructure under stress. The CME’s reopening process includes an Indicative Opening Price period followed by a no-cancel lockdown phase immediately before trading resumes.
That makes the first tradable print after resolution a meaningful benchmark for whether the weekend tape accurately drafted where risk needed to land. In this case, it did.
Why continuous markets can lead
Multiple mechanisms explain why an always-on venue might generate useful price signals even when benchmark liquidity dwarfs it during normal hours.
Continuity beats size when the reference is closed. The open market becomes the marginal venue for first-response risk expression.
Traders holding positions over the weekend or needing to hedge breaking news can’t wait for Sunday evening. They route to whatever accepts orders.
Reopen microstructure creates a discrete event that continuous markets can anticipate.
CME Globex’s pre-open mechanics, such as IOP calculation, lockdown period, and opening resolution, turn the reopen into a moment.
Continuous venues sketch the path toward that moment in real time, producing a signal that legacy markets either validate or correct when they resume.
Positioning telemetry runs live. Funding rates reveal the price of leverage in real time. When funding flips sharply positive or negative, it signals where pressure lies and which side must pay for the privilege of staying in the trade.
Open interest shifts without waiting for Monday. That information feeds back into price before benchmarks reopen.
Global participation changes the weekend cohort. The weekend tape isn’t just absent from US institutional desks. It’s different time zones, different hedgers, different urgency profiles showing up when the primary venue is dark.
That mix might be less deep, but it’s not necessarily less informed about macro shocks hitting during off-hours.
Operational risk matters more than participants assume. Even “always-on” legacy infrastructure can go offline unexpectedly. CME metals futures experienced an outage on Feb. 25, reminding traders that benchmark status doesn’t guarantee access.
The platforms that actually stayed live during that window became the only venue for price discovery, whether they were designed for that role or not.
Daily signals, zero noise.
Market-moving headlines and context delivered every morning in one tight read.
5-minute digest 100k+ readers
Free. No spam. Unsubscribe any time.
Whoops, looks like there was a problem. Please try again.
You’re subscribed. Welcome aboard.
But don’t overread one weekend
A weekend can reveal a market’s reflexes, but it doesn’t settle the verdict.
Perpetuals aren’t futures. Index construction, mark price methodology, and funding mechanics can distort the price signal in ways that don’t show up in a simple premium comparison.
Liquidity can be optical: spreads look tight until depth disappears, and stress tests often reveal that bid-ask stability during calm periods doesn’t hold when everyone needs the same side.
Volume can lie. High volume per unit of open interest often reflects churn or recycling rather than new conviction. Doshi himself flagged this concern: if the same positions flip back and forth, the tape might look active without actually incorporating new information.
One weekend isn’t a law, and broader sampling complicates the narrative.
Blockworks analyzed Hyperliquid’s builder-deployed equity perpetuals and found that weekend “pre-open mid” prices came closer to the Monday reopen only about 50.7% of the time, with a median improvement of roughly 0.4 basis points.
That suggests the gold and silver performance during the Iranian weekend might be more about the specific asset class, the specific shock, and the specific participant mix than a generalizable advantage.


Bitcoin recovers instantly after Iran war crashes price but one Monday number could flip the next move
Bitcoin’s weekend wick shocked traders while liquidity is vanishing so why did price snap back?
Feb 28, 2026 · Liam ‘Akiba’ Wright
Markets that run continuously don’t automatically generate better signals. They generate different signals, and whether those signals prove useful depends on depth, participant sophistication, and how closely the contract design tracks the underlying benchmark.
| Measure | What it indicates (if clean) | How it can mislead | What to sanity-check |
|---|---|---|---|
| Perp–futures basis | Carry vs funding effects; how perp tracks spot vs front-month futures | Comparing unlike contracts (carry-embedded futures vs spot-anchored perp) can look like “signal” | Normalize vs spot; adjust for carry; compare basis during overlapping weekday hours as baseline |
| Funding rate | Directional pressure / “price of leverage” in real time | Can flip from mechanical imbalances (hedging flow, inventory) rather than new information | Compare funding shifts to price moves + open interest change; check persistence (hours, not minutes) |
| Open interest (OI) | Conviction / position build or unwind | OI can stay flat while participants churn; OI can be capped/managed by venue rules | Pair OI with liquidations + funding; look at changes by session (weekend vs weekday) |
| Volume | Activity / responsiveness to news | Can be recycling/churn (same risk flipping hands) rather than fresh conviction | Use volume ÷ OI; check trade size distribution; look for volume spikes without OI change |
| Spreads (top-of-book) | Instant liquidity / transaction cost | Optical: tight spreads with shallow depth; spreads stable until they suddenly gap | Add depth-at-1bp/5bp; average size-to-fill; slippage on market orders during the shock window |
| Mark price / oracle design | Stability; reduces manipulation; affects liquidations | Mark can lag real trades or smooth moves; different venues compute differently | Compare last vs mid vs mark; note oracle inputs and update cadence; check liquidation triggers vs mark |
| Reopen “first print” | Benchmark convergence; whether weekend tape “drafted the gap” | Pre-open mechanics can distort what counts as “first” (indications, resolution) | Define reopen anchor consistently (post-resolution tradable print); use the same candle alignment for all venues |
| One-weekend effect | Reflexes under stress; a stress test snapshot | Not generalizable; event-specific cohort/liq conditions dominate | Compare multiple weekends / shocks; separate “headline weekends” from normal weekends |
| Blockworks equity-perp sample | Base rate reality check on weekend predictive power | Different asset class/shock; builder-deployed equity perps may behave differently than metals | Note: ~50.7% closer to Monday reopen; ~0.4 bps median improvement; treat metals case as a special episode, not a rule |
Who owns Sunday night
The scale involved isn’t trivial anymore. Hyperliquid currently shows over $5 billion in perpetual open interest and processes billions in daily volume.
The platform’s HIP-3 mechanism allows builders to deploy new perpetual markets if they maintain 500,000 staked HYPE tokens and face validator-enforced slashing for malicious operation.
Open interest caps and other guardrails attempt to manage risk, but the core feature is permissionless market creation with continuous uptime.
Mainstream financial media noticed. MarketWatch explicitly reported traders using venues like Hyperliquid to gauge where crude oil might open after the weekend attack.
Bloomberg framed always-on perpetuals as the 24/7 hedge venue for oil, gold, and silver amid escalating tensions with Iran.
These aren’t crypto publications hyping native infrastructure, but traditional outlets acknowledging that price discovery has relocated because the benchmark was closed and risk needed to be expressed.
If always-on venues become the consistent first responder for weekend macro shocks, traditional exchanges increasingly become the settlement and reference reopen.
That changes who sets the narrative on Mondays. Instead of “markets gapped on news,” the frame becomes “markets caught up to the price already forming.” The gap was already drafted. The benchmark validated or corrected it.
CME itself understands the competitive dimension.
The exchange has moved toward 24/7 access in cryptocurrency derivatives, explicitly citing demand for always-on trading. Hours are now a product feature rather than an operational constraint.
The question now is which assets will develop reliable 24/7 shadow prices next, and whether those shadow prices prove informative enough for participants to trust them when the benchmark is dark.
The reopening is starting before it actually opens. That’s not ideology, but infrastructure responding to the reality that geopolitical risk doesn’t respect CME Globex maintenance windows.
The market that doesn’t sleep is becoming the market that explains the gap, and legacy venues will either extend their hours or accept that someone else writes the first draft of Monday.