U.S. Treasury yields retreat from the highest levels in decades, while bitcoin holds above $64,000.
Holds
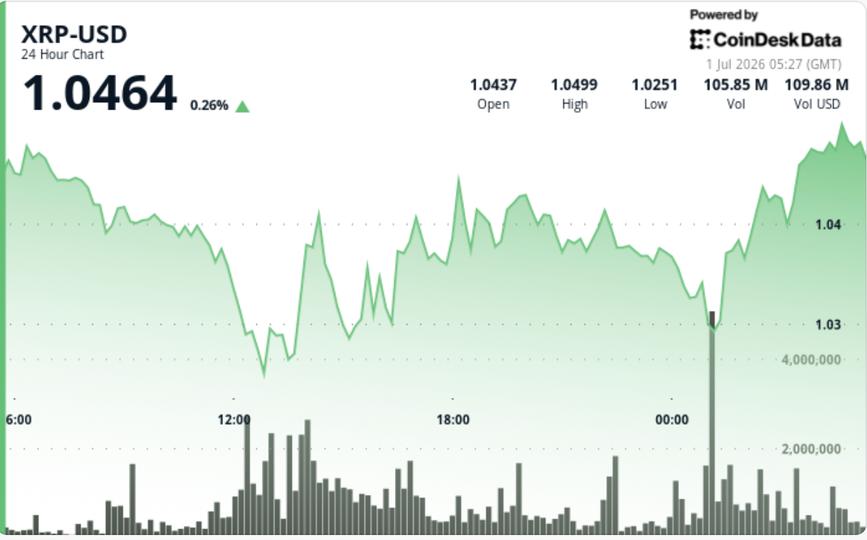
• Selling pressure broke support near $1.0350 during the June 30 session before XRP tested $1.0249 and stabilized.
• Buyers stepped in near the lows, with volume rising to 92.73 million XRP at 01:00 UTC, about 134% above the 24-hour average.
• A late rebound pushed XRP from $1.024 to $1.038, with volume spiking to 3.88 million during the break above $1.032 resistance.
Technical Analysis
• The key development is that XRP continues to defend the $1.00 area even as sentiment across crypto remains weak.
• The leverage reset improves the short-term setup. Open interest has collapsed, funding rates have turned negative and forced liquidations have cleared out crowded long positions.
• The bounce from $1.02 showed buyers are still active near support, but the move has not yet reclaimed the levels needed to shift momentum higher.
• XRP remains below major moving averages, with the 20-day EMA near $1.11, the 50-day near $1.20, the 100-day near $1.31 and the 200-day near $1.52.
• The 14-day RSI has recovered to about 33, showing selling pressure has eased, but momentum remains weak and below neutral levels.
• Bollinger Bands have narrowed after June’s selloff, pointing to lower volatility, but XRP still needs to reclaim the middle band near $1.12 to show a stronger recovery.
Bitcoin (BTC) starts a new week in fighting form as $80,000 support survives a volatile weekly close.
Key points:
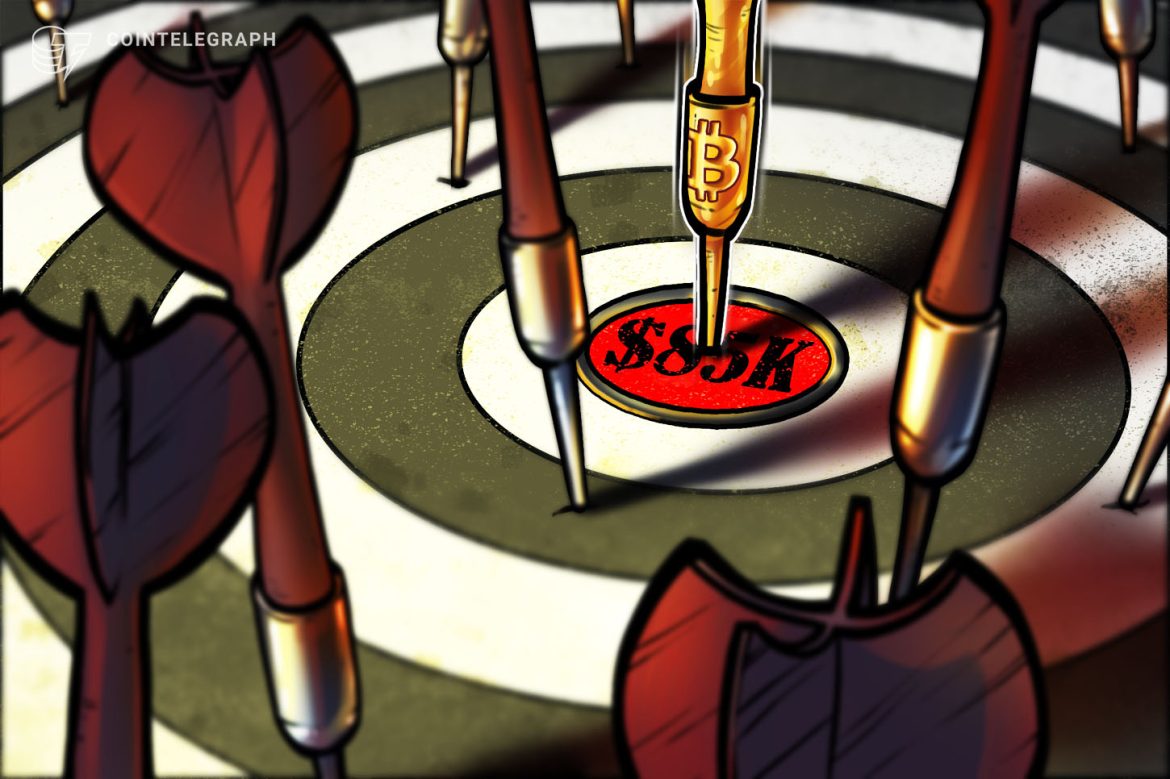
- Bitcoin preserves the potential for upside continuation as one trader pencils in $85,000 for the coming days.
- Consolidation is also a popular prediction as BTC/USD surfs CME futures gaps and grabs liquidity.
- The US-Iran war continues to provide snap market turbulence across crypto and risk assets.
- Buyer commitment to BTC leads analysis to forecast a longer-term uptrend.
- Two Bitcoin price metrics are about to deliver their first “golden cross” in nearly three years.
Latest BTC price targets include $85,000
Bitcoin saw classic end-of-week volatility thanks to geopolitical developments as price briefly passed $82,000.
Data from TradingView showed that the move was short-lived, however, with BTC/USD quickly dropping back toward the $80,000 mark.
BTC/USD one-hour chart. Source: Cointelegraph/TradingView
The result was liquidity grabs that neutralized both long and short BTC positions on exchange order books. Data from CoinGlass puts the 24-hour crypto liquidation total at more than $400 million.

Crypto liquidation history (screenshot). Source: CoinGlass
“The Liquidation Heatmap on $BTC is currently looking STACKED with liquidity,” X trading account Cryptic Trades commented in a post just before the volatility hit.
“Both sides are filled with liquidity on both sides, which is why I believe that market makers are going to flush out both sides before there’s a bigger directional move out of this range.”

Binance BTC/USDT liquidation heatmap. Source: CoinGlass
Bitcoin is not without its bullish targets, however, as the mid-$80,000 range comes into view.
In an X thread mapping out the week’s potential price moves, trader CrypNuevo argued that BTC/USD holding $80,000 as support was the ideal foundation for continuation higher.
“Price has found acceptance above $81k and the EMAs have caught up,” he wrote, referring to moving averages (MAs) on daily time frames.
“Therefore, we’re expecting price to potentially push higher to $84k-$85k next week.”

BTC/USDT four-hour chart. Source: CrypNuevo/X
Crypto trader and analyst Michaël van de Poppe continued the bullish sentiment, saying that the “trend remains upward.”
“The 21-MA is below the current price; there’s still a lot of momentum, and there’s no breakdown of the higher-high, higher-low structure at all,” he told X followers on Monday.
“There’s no reason to believe that we’re stalling soon.”

BTC/USDT one-day chart. Source: Michaël van de Poppe/X
Bitcoin lacks futures “trigger” to break consolidation
Some market participants believe that conditions are not yet right for a decisive BTC price breakout.
Trader and analyst Rekt Capital is one of them, pointing to nearby “gaps” in CME Group’s Bitcoin futures.
These gaps, which are created when BTC/USD sees weekend volatility, often act as short-term BTC price magnets.
“Bitcoin has reached its CME Gap (red). BTC is holding the bottom of it as support but rejecting from the top of it,” Rekt Capital told X followers while analyzing the weekly futures chart.
“Price will need to Weekly Close above the top of this area if it wants to rally higher. Until that trigger is in -> consolidation.”

CME Bitcoin futures one-week chart. Source: Rekt Capital/X
Trader Daan Crypto Trades revealed other gaps around the spot price.
“We now have a few gaps left in close proximity: $78K, $80.3K & $84K,” he confirmed, with the highest gap capping recent local highs.

CME Bitcoin futures one-hour chart. Source: Daan Crypto Trades/X
Elsewhere, Cryptic Trades argued that the combination of declining open interest and rising price should deliver similar range-bound trading conditions for now.
“Because of this, I believe the most likely short-term outcome remains further consolidation, with both longs and shorts getting flushed before the market makes a larger directional move out of this range,” it concluded.
CPI leads key inflation week for Fed
The US-Iran war continues to be the main source of flash volatility for crypto and risk assets this week.
Bitcoin’s weekly close was marked by reactionary behavior as markets digested the latest developments in peace negotiations.
After trading terms back and forth — which had given markets reason for optimism last week — US President Donald Trump said that he did not “like” Iran’s latest proposals.
In a post on Truth Social, Trump called the terms “totally unacceptable.”

Source: Truth Social
The result was WTI crude oil quickly heading back above $100, while BTC/USD spiked to near $82,500 before giving back all its gains.

CFDs on WTI crude oil one-hour chart. Source: Cointelegraph/TradingView
“US-Iran peace talks are being priced-out again,” trading resource The Kobeissi Letter wrote in a response on X.
Oil prices will remain in the spotlight as new US Consumer Price Index (CPI) data is released. As Cointelegraph reported, this inflation gauge is particularly sensitive to oil-market volatility.
The April Producer Price Index (PPI) release will follow on Wednesday.

Source: Cointelegraph/X
Commenting, investment manager Peter Tarr highlighted the implications of the data for Kevin Warsh, President Trump’s nominee to chair the Federal Reserve
“Elevated oil prices will show impact reports. Important report for Warsh era Fed and markets,” he wrote on X.
Trump last month said that he “would” be disappointed if Warsh failed to cut interest rates at the Fed’s June meeting. The latest data from CME Group’s FedWatch Tool, however, shows that markets see only a 4.2% chance of that outcome.

Fed target-rate probabilities for June 17 FOMC meeting (screenshot). Source: CME Group
While this could be a headwind for crypto, traders believe that the CPI result itself is already “priced in” to BTC price action.
Analysis sees “sustainable uptrend” for Bitcoin
The latest Bitcoin analysis remains hopeful that a “sustained” market rebound is around the corner.
In one of its QuickTake blog posts on Sunday, onchain analytics platform CryptoQuant flagged positive changes in exchange-trader behavior.
“Looking at the $BTC Spot Taker CVD (90-day) chart on CryptoQuant, we are seeing a significant shift in capital flow structure,” contributor Researcher Rei summarized.
Rei referred to cumulative volume delta (CVD) data, which records the difference between buy and sell volume at given price points over time.
“Following a neutral accumulation phase, the indicator has turned Green. This means Buyers are no longer waiting at lower price levels (Limit Orders) but have started “sweeping” the order book directly (Market Buy),” he continued.
The data implies that large-volume investors have flipped from speculation to a hodl-based mentality, while macro conditions support the return of liquidity to crypto.
Rei described Bitcoin as a “top-tier growth asset.”
“Real demand has prevailed,” he concluded.
“When bulls are willing to pay higher prices to own $BTC, a sustainable uptrend usually follows.”

Bitcoin spot taker CVD (screenshot). Source: CryptoQuant
Onchain metrics prepare rare golden cross
More good news comes from two other BTC price metrics about to perform their first “golden cross” since mid-2023.
Related: Bitcoin Bollinger Bands push key breakout as creator acts on positive signal
Bitcoin’s market value to realized value (MVRV) ratio, which compares Bitcoin’s market cap to the price at which the supply last moved, also known as its “realized cap,” is one of them.
Recently, MVRV has rebounded from local lows to record some of its highest readings of 2026.
“This signal reflects a clear improvement in Bitcoin’s market valuation relative to its realized value, suggesting that the market has begun to regain an important portion of its momentum following a period of decline and rebalancing during the first months of the year,” CryptoQuant commented last week.

Bitcoin MVRV ratio. Source: CryptoQuant
Now, MVRV is about to cross the 200-day exponential moving average (EMA) for the first time in nearly three years. Data shows that past golden crosses have preceded snap BTC price upside.
“This signal is a representative trend reversal signal and is a bullish indicator,” CryptoQuant contributor CW8900 confirmed on Sunday.

BTC/USD chart with MVRV data (screenshot). Source: CryptoQuant
Solana price prediction: here’s why rebound to $120 is possible if $90 holds
- $90 acts as crucial support for a potential Solana price upward move.
- Rising short-term momentum supports a possible rebound.
- Breaking $100 could open the path toward $120.
Solana (SOL), currently trading at around $91.90, has been under immense bear pressure in recent months.
The token has seen a steady decline from its previous highs, but recent technical signals suggest a rebound could be in play.
The $90 level is emerging as a key support level, which, if held, could trigger a strong upward move.
Technical analysis
The immediate support level at $90 has been tested several times in recent weeks, and every time Solana approaches it, buyers have stepped in to prevent further declines.
Technical charts show that holding this level is critical since a break below it could lead to a pullback toward $77.

On the other hand, maintaining $90 provides a foundation for bulls to push higher.
Momentum indicators show a mixed picture, with shorter timeframe charts indicating growing strength, although some oscillators are still signalling caution.
This suggests that while there is potential for upward movement, the market is waiting for confirmation.
Trading volume has also picked up slightly in the past month, showing renewed interest among traders.
Yet, on-chain activity has dropped, indicating fewer transactions on the network.
This combination of higher trading volume and lower on-chain use points to speculative interest driving the short-term rally.
Why a rebound to $120 is possible
The combination of technical support, rising volume, and potential bullish momentum makes the $120 target realistic if $90 holds.
If Solana holds $90, the path to $96.47 is relatively clear.
Once $96.47 is broken and sustained, a move toward $120 becomes plausible.
This would represent a nearly 30% gain from current levels, making it an attractive scenario for bullish traders.
Historical patterns also support this possibility.
In previous cycles, Solana has seen rapid rallies after establishing such strong support levels.
Short-term momentum is improving, and daily momentum indicators such as Moving Average Convergence Divergence (MACD) and the Relative Strength Index (RSI) are turning more positive.
The MACD histogram is above the middle line, and the signal line has moved above the main MACD line, and the RSI has rebounded above 50 after a slight dip, signalling a possible rebound in the near term.
These suggest that buyers are gaining control, at least for the near term.
However, caution still remains since any failure at the resistance at $96.47 could lead to sideways trading or a complete collapse.
In addition, the market is sensitive to broader cryptocurrency trends, and a strong rebound in Bitcoin (BTC) and Ethereum (ETH) could further lift Solana’s price, while weakness in these coins could cap Solana’s gains.
Share this article
Categories
Tags
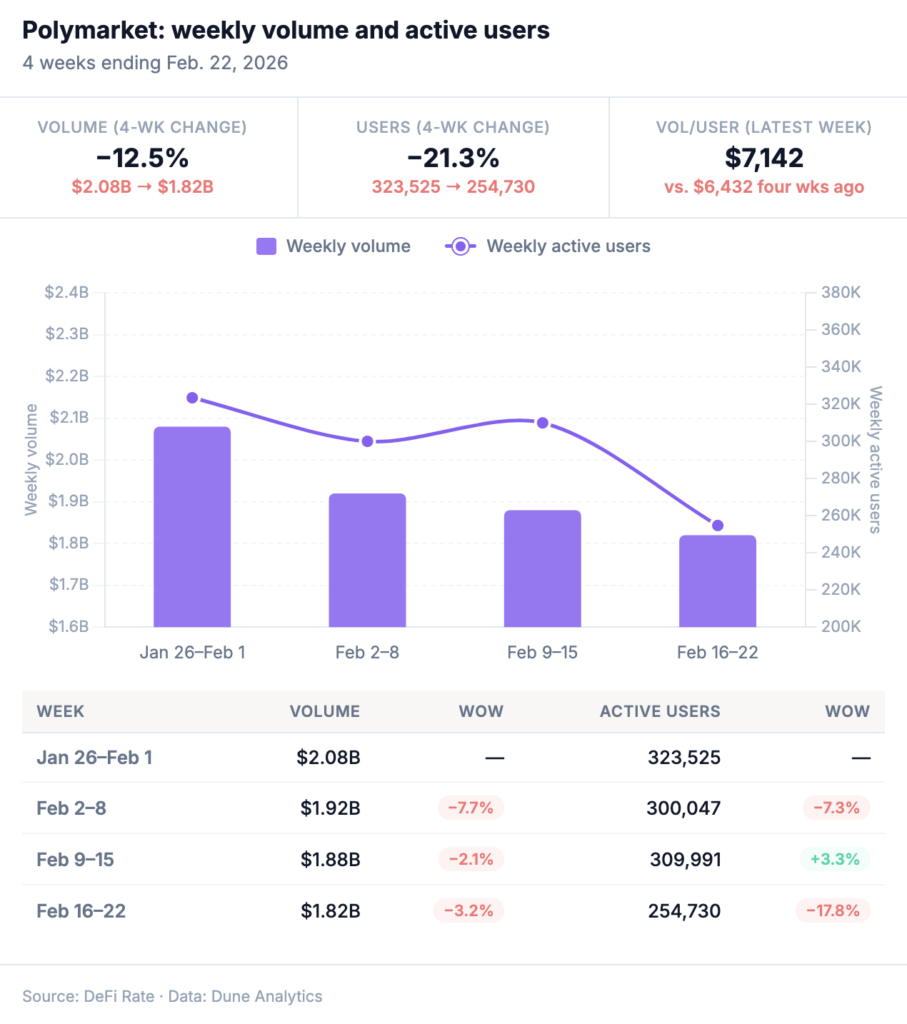
Weekly notional volume across prediction market platforms dipped 1.4% to $5.25 billion for Feb. 16–22. Kalshi jumped 6.7% to $2.59 billion as Polymarket slid 3.2% WoW to $1.83 billion.
Prediction markets appear to be consolidating, posting $5.25 billion across all tracked platforms for the week ending Feb. 22. The weekly volume was essentially flat against the $5.33 billion posted the prior week, and it marks the second consecutive week without a meaningful swing in either direction after the Super Bowl unwind.
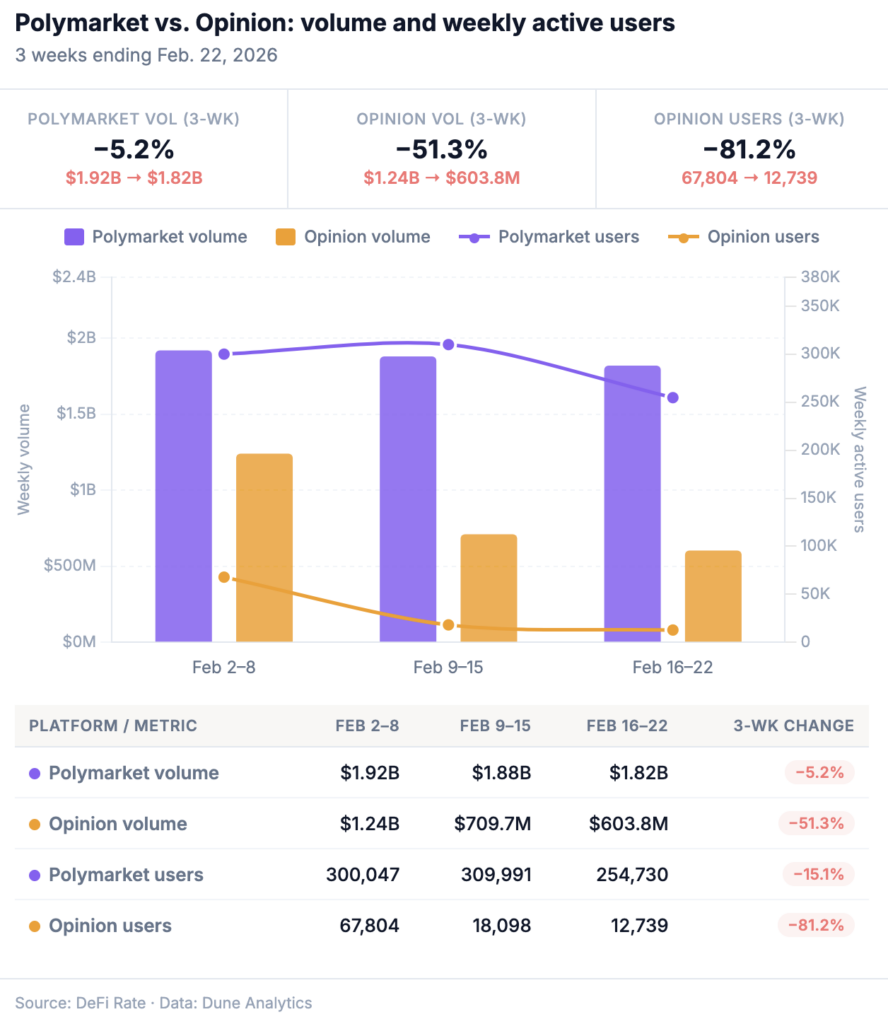
But a top-line that barely moves can still tell a story, and the internals this week are more interesting than the surface suggests. Kalshi’s volume jumped 6.7% week-over-week, pushing its market share from 45.5% to 49.3% as Polymarket’s share stayed relatively flat at 34.6%. Opinion logged a third straight week of double-digit percentage declines. And on the user side, Polymarket’s active base dropped nearly 18% even as the platform’s transaction count climbed.
According to DeFi Rate’s prediction market tracker, Kalshi and Polymarket combined for $4.41 billion this week — up from $4.31 billion the week prior as the main prediction market duo reinforces its baseline without NFL or another major trading catalyst.
Platform breakdown: Week of Feb. 16-22
The full week-over-week comparison for the weeks ending Feb. 15 and Feb. 22 continue the trend of platforms outside of Kalshi and Polymarket showing more volatility from one week to the next. Meanwhile, Kalshi’s $2.59 billion and Polymarket’s $1.83 billion weekly trading volume fall within expected ranges.
| Platform | Feb 9–15 | Feb 16–22 | WoW change | Mkt share (2/16–22) |
|---|---|---|---|---|
| Kalshi | $2.43B | $2.59B | +6.7% | 49.3% |
| Polymarket | $1.88B | $1.82B | −3.2% | 34.6% |
| Opinion | $709.7M | $603.8M | −14.9% | 11.5% |
| predict.fun | $184.7M | $220.3M | +19.3% | 4.2% |
| Other* | $126.4M | $12.6M | — | 0.2% |
| Overtime.io | $3.9M | $4.5M | +14.4% | 0.1% |
| Total | $5.33B | $5.25B | −1.4% | 100% |
*”Other” on the Dune dashboard groups Limitless, Myriad, and ForecastEx for UX reasons, as noted by Dune. The prior week tracked Limitless ($109.4M) and Myriad ($17.0M) as separate line items. The sharp apparent decline in “Other” reflects this grouping change rather than a volume collapse at those platforms. Whether Limitless maintained its +58.7% gain from the prior week is not determinable from current data.
The week reinforced the two-tier structure of the market. Kalshi and Polymarket together accounted for 83.9% of all tracked volume, up from 80.8% the prior week. That concentration has ticked upward for three consecutive weeks, as Opinion contracts and the smaller platforms remain too small to meaningfully offset the shift.
Kalshi sustains trading volume post-Super Bowl
Kalshi’s $2.59 billion in weekly volume during the second week after the Super Bowl is not what you’d expect from a platform whose top volume driver just went dark. Kalshi was up 6.7% WoW, its second consecutive positive week, and crossed 49% market share for the first time in the current reporting period.
Looking at the past six weeks of notional volume data, Kalshi is settling in as consistent market leader with Polymarket a clear No. 2, with sports volume the main differentiator as we’ve already established.
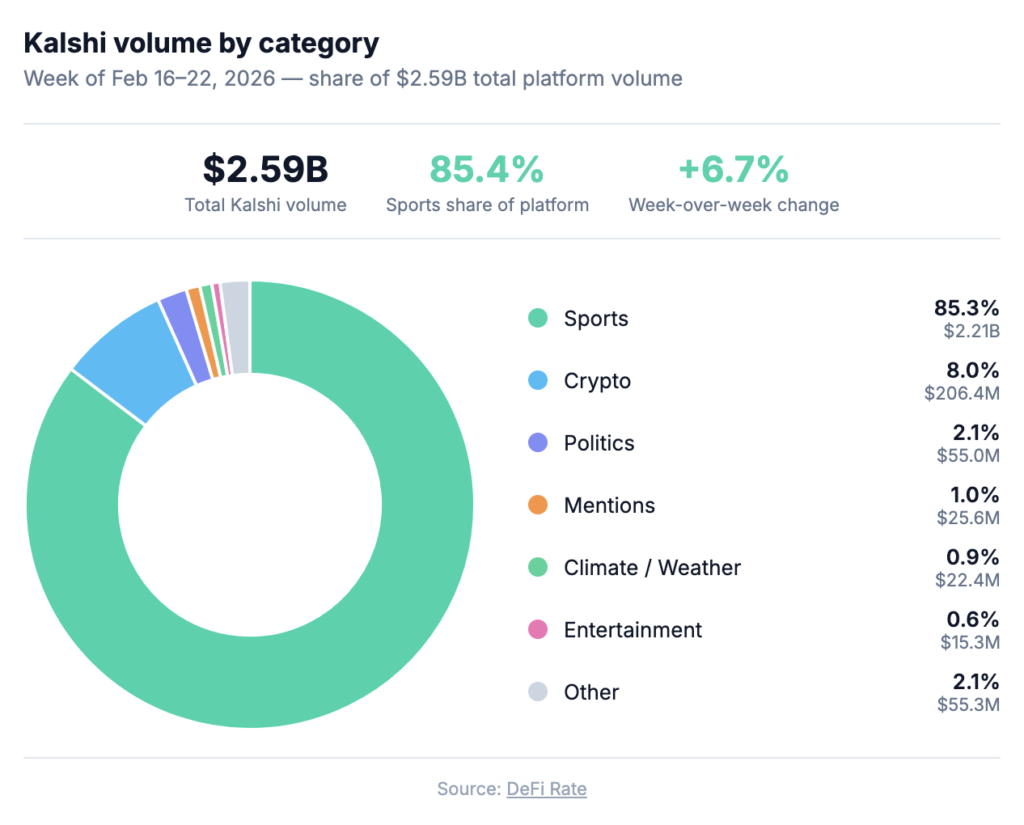
The category breakdown explains what’s filling the post-NFL gap. Sports volume came in at $2.21 billion, up from $1.996 billion the prior week: a 10.9% increase without any football on the schedule. The main drivers include NBA, NCAAB and some Olympic events, notably the USA-Canada hockey final. The NBA regular season resumed Thursday after the All-Star break, with conference standings tightening as the playoff picture comes into focus, and college basketball markets deepening as Selection Sunday (March 15) moves into view.
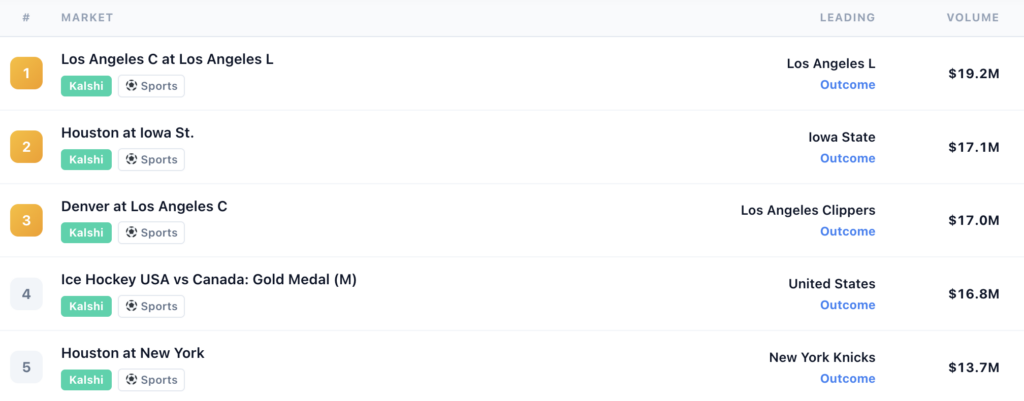
Neither the NBA nor the NCAA tournament individually matches the Super Bowl as a single-event volume catalyst, but together they represent weeks of sustained, high-engagement trading rather than a one-day spike. Kalshi’s sports concentration deepened again this week, from 82.2% to 85.4% of total platform volume. The platform is not diversifying away from sports, though politics will likely grow in category share as we get closer to the midterms. Here are Kalshi’s top five volume markets for the trailing seven days, according to our tracking.

The non-sports categories, while growing in isolation, still pale in comparison to the sports engine. Crypto was the second-largest category at $206.4M (8.0% of platform volume), followed by politics at $55.0M (2.1%) and mentions at $25.6M (1.0%). Climate and weather showed up meaningfully at $22.4M, and entertainment dropped to $15.3M — down from $22.7M the prior week, continuing the post-Super Bowl normalization.

Interesting to note that Kalshi’s crypto category has now grown in each of the past two weeks (+22% last week, +8.3% this week). Economics and financials are present but thin. The non-sports diversification is real, but at 14.6% of total volume, it’s still a footnote to the sports story. Vitalik Buterin‘s concerns, which we covered last week, that prediction markets are over-converging toward sports and short-term crypto speculation at the expense of durable financial utility is not getting any less relevant as you watch these category splits week by week.
Polymarket: Resilient on volume as weekly users decline
Polymarket held up reasonably well this week on volume — down 3.2% to $1.82 billion — but the user number that came back from Dune is hard to ignore. Polymarket’s 254,730 weekly active users was down from 309,991 the prior week, representing a drop of nearly 18% in one week.

That’s a significant user pullback on a smaller volume dip. The data raises some questions: Polymarket processed 22.7 million transactions last week with 17.8% fewer users, meaning the remaining base traded more frequently and likely in larger average trade sizes. Whether that’s healthy consolidation around engaged power users or early-stage retail churn remains to be seen in the coming weeks.
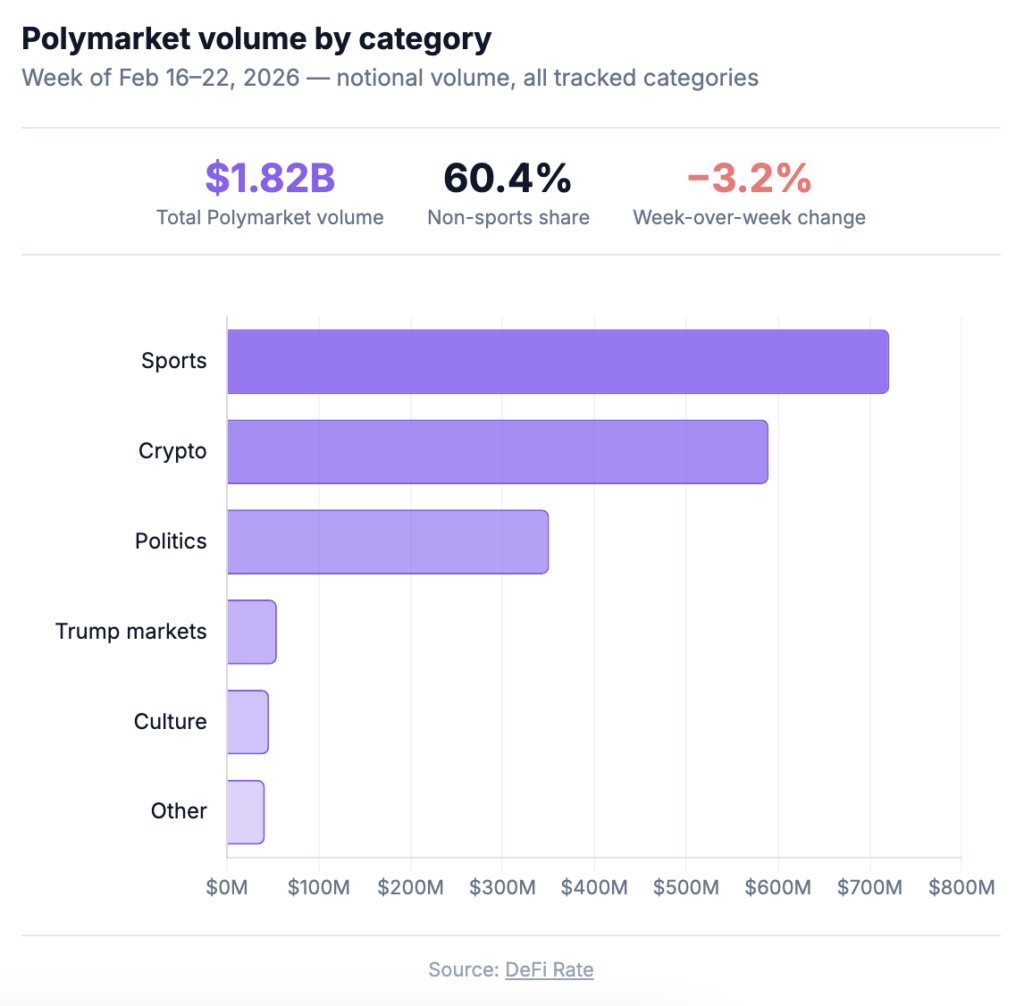
Meanwhile, the category split continues to differentiate Polymarket from Kalshi in significant ways. Sports remained the top category at $721.2M (39.6% of platform volume), but crypto and politics together contributed another $940.6M, with Trump-specific markets tracked as a discrete category at $54.4M. Polymarket’s top three categories span genuinely different domains and different user motivations, which serves as a structural buffer when any single category cools.

A few category moves worth noting. Culture jumped to $46.0M, nearly doubling from last week’s $25.3M. Economy showed up as a discrete category at $24.2M as earnings trading fell sharply to $391K from last week’s $5.4M. The cross-platform convergence on the March Fed decision is also worth flagging: both Kalshi (96%) and Polymarket (96%) are pricing no rate cut at the March meeting, a near-identical read on a macro event across independently operated markets, consistent with CME FedWatch pricing above 97% hold probability. It’s a clear illustration of what the Fed study we covered last week was pointing at.
The more notable Polymarket news this week didn’t come from the volume data. The platform launched a public API and permissionless liquidity infrastructure, a structural shift DeFi Rate covered separately. The long-term read on that move: Polymarket US is building toward a market-maker ecosystem and programmatic trading that could change who generates volume on the platform and how. The user count may matter less if institutional and API-driven flow scales.
Kalshi vs. Polymarket: The split deepens
The sports vs. non-sports divide between these two platforms has been a recurring theme in our weekly coverage, and this week sharpened it further.
| Segment | Kalshi | Polymarket | Total |
|---|---|---|---|
| Sports | $2.21B (85.4% of Kalshi) | $721.2M (39.6% of Poly) | $2.93B |
| Non-sports | $377.6M (14.6%) | $1.10B (60.4%) | $1.48B |
In sports markets, Kalshi’s 3:1 lead from last week widened slightly. In non-sports, Polymarket’s lead held near the same ratio. Two platforms at roughly similar overall scale continue to serve fundamentally different but overlapping market functions.
The divergence is intentional on both sides. Kalshi’s Giannis partnership and Robinhood distribution infrastructure are explicitly sports-facing. Polymarket’s API buildout and deep crypto/politics liquidity are explicitly not. The question that will define the next six months isn’t which model wins as both are clearly working, but which model is better insulated when the sports calendar thins out.
Opinion’s decline continues
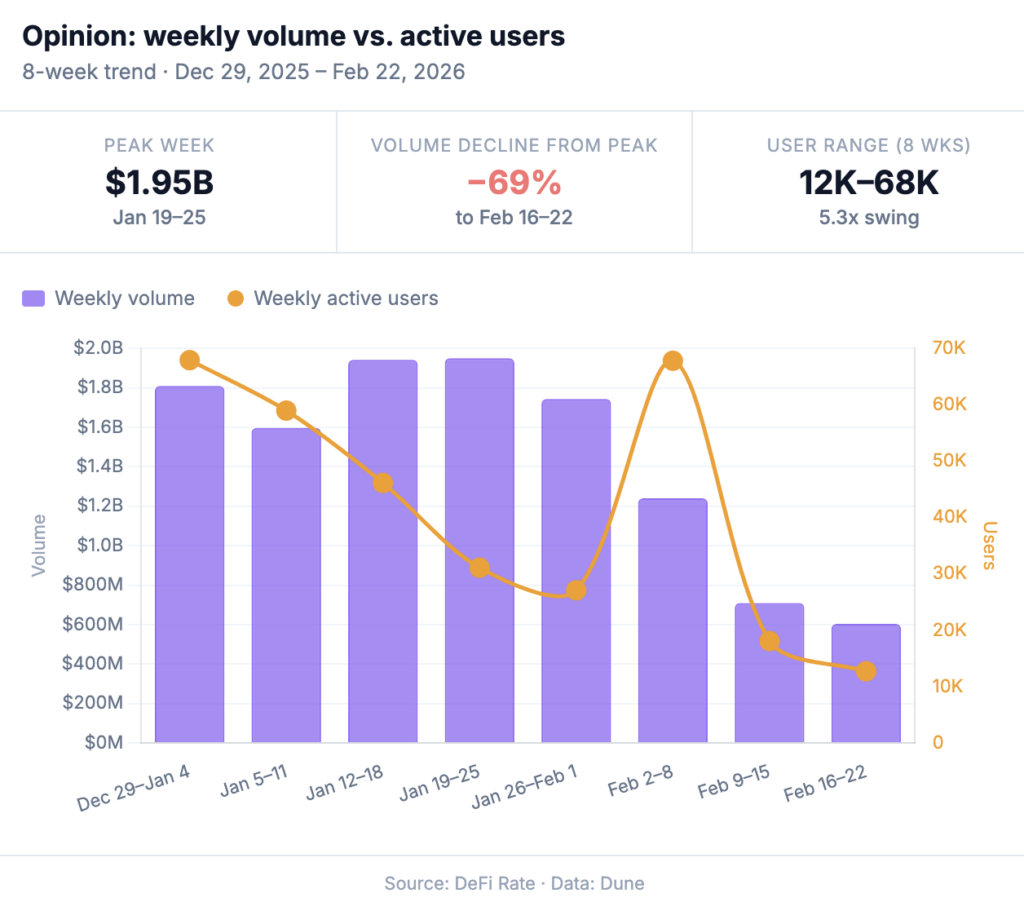
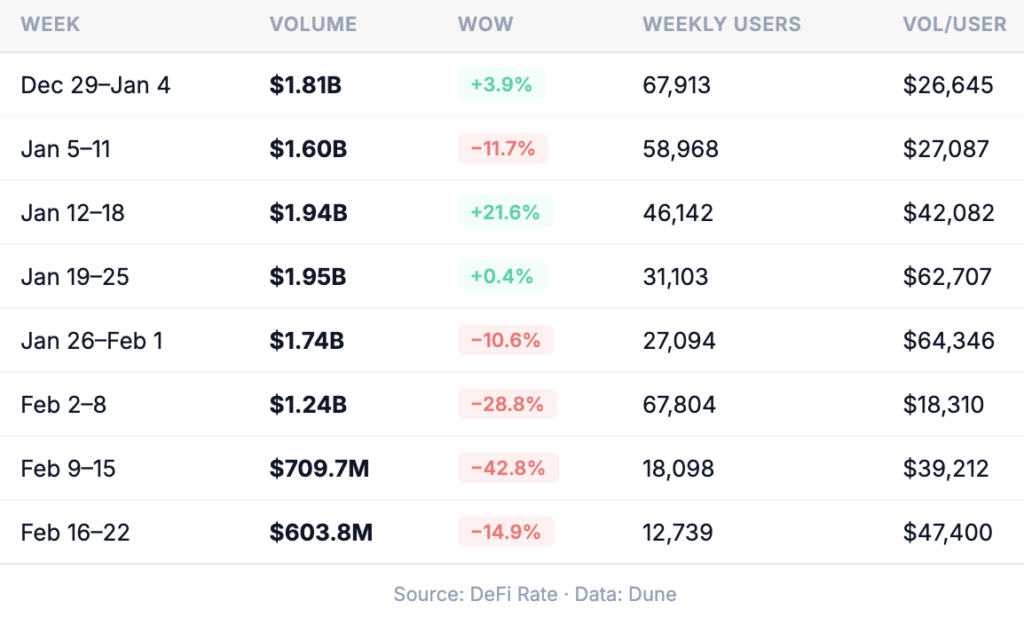
Opinion logged a third straight week of meaningful volume decline coming in at $603.8M, down 14.9% from $709.7M. The platform has now shed 63.6% of its volume since its Jan. 19 peak of $1.95 billion across four consecutive down weeks.
We published a deep dive on Opinion’s data this week, and the new weekly data reinforces that analysis. The platform’s user count fell to 12,739, down 29.6% from 18,098 the prior week. Its per-user volume figure climbed again: at $603.8M across 12,739 users, that’s roughly $47,400 per user per week, up from ~$39,200 the week before. The user base is contracting faster than the volume, which means the remaining traders are becoming even more concentrated.

The transaction count offers further context. Opinion processed 227,847 transactions this week, generating $603.8M in volume, an implied average trade size of approximately $2,650 per transaction. Polymarket’s 22.7 million transactions generated $1.82 billion, for an average of roughly $80 per transaction. The gap, now approximately 33:1, has not narrowed meaningfully through Opinion’s growth or its subsequent decline. And it continues to point to inflated, artificial trading volumes as we noted in our separate Opinion platform analysis.


Opinion remains the third-largest exchange in tracked volume by a wide margin. It has real infrastructure, credible backers in Hack VC and Jump Crypto, and market categories that fill genuine gaps for non-US traders outside the Kalshi/Polymarket duopoly. But the structural questions documented in our deep dive haven’t resolved themselves. Until the platform’s volume-to-transaction ratio converges toward industry norms, or an independent analysis of BNB Chain activity addresses the wash trading question, Opinion’s headline figures warrant the same careful reading they always have.
Transactions and users: The full picture
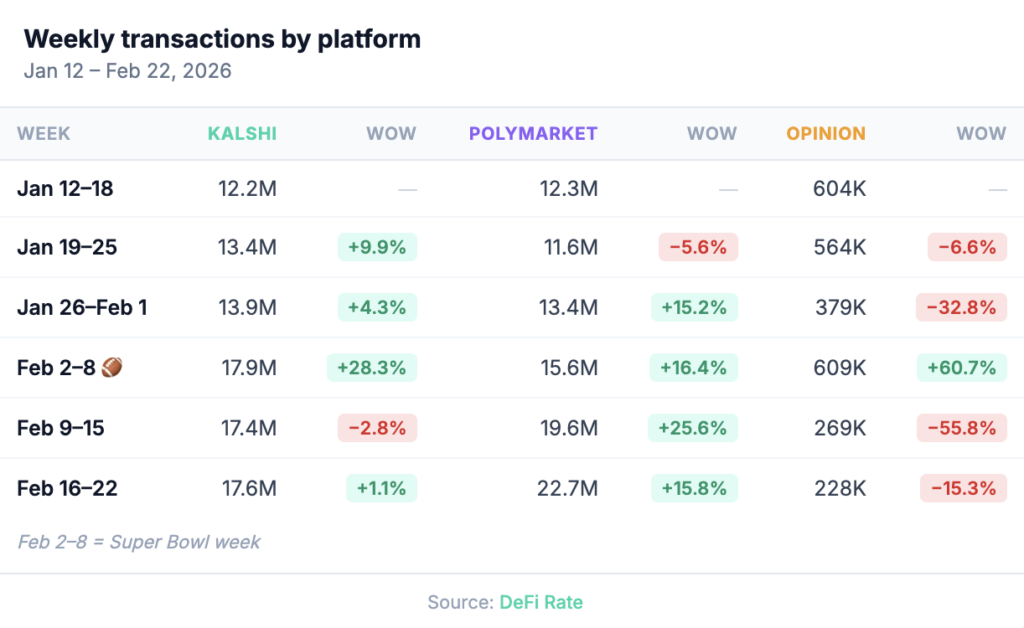
The transaction count divergence between Polymarket and Opinion this week is stark. Polymarket processed 22.7 million transactions — 100x more than Opinion’s 227,847 — while generating roughly 3x the volume.

Kalshi’s 17.6 million transactions were nearly neck and neck with Polymarket’s, reflecting the platform’s high-frequency sports trading infrastructure. Together, Kalshi and Polymarket accounted for 98.2% of all tracked transactions this week.
The 20.3% drop in total tracked users (excluding Kalshi), from 362,704 to 289,144 is the week’s most notable macro signal on the demand side. Whether this is post-Super Bowl seasonality running through the system or something more structural will be clearer in the coming weeks. Retail user attrition after peak event cycles is a known pattern in sports betting; the question for prediction markets is how deep the drop-off goes before the next catalyst, which is coming up in March.
What comes next?
The sports calendar is about to get busy again. The NBA resumed Thursday after the All-Star break, and Selection Sunday is March 15 — just three weeks out. Once the bracket drops, March Madness becomes Kalshi’s biggest volume event outside the NFL season (at least until major elections). Last year’s Robinhood partnership drove over $200 million in tournament volume. With a broader distribution footprint and a year of platform maturity, that ceiling is much higher now. The next four weeks are the real test of whether Kalshi’s post-Super Bowl floor holds: if the $2.4–2.6B weekly run rate sustains through mid-March, it suggests the retail base is genuinely sticky and not purely event-driven.
For Polymarket, the API launch and permissionless liquidity infrastructure matter more than any single week’s numbers. If programmatic trading and market-maker participation scale, volume generation may decouple from user count in ways the weekly active user metric doesn’t yet capture.
Opinion’s trajectory remains an open question. Three consecutive weeks of double-digit decline following four weeks of prior losses is a sustained contraction from the January peak. Whether it stabilizes, continues toward the $400–500M range, or reverses depends largely on the $OPN token timeline and what that does to points farming incentives — neither of which is visible in the current data.
The macro picture hasn’t changed: an industry that grew 13x in six months doesn’t need to panic over a few flat weeks. But as the Super Bowl cycle fully clears, the next month will tell us what this market actually looks like without the NFL underneath it.
Data sourced from DeFi Rate’s prediction market tracker and Dune Data Dashboards. Weekly data reflects the calendar week of Feb. 16-22 unless otherwise noted. Note: For UX reasons, projects including Limitless, Myriad, and ForecastEx are grouped together under “Other” on the Dune dashboard.
Valerie Cross
Valerie Cross is a reporter, editor, and prediction markets analyst with more than a decade of experience covering legal gaming and emerging financial markets. She joined DeFi Rate in 2026 after reporting on the rise of mainstream prediction markets and previously held senior editorial roles at Prediction News and Catena Media. Valerie holds a BA from Furman University and MA and PhD degrees from Indiana University.
Bitcoin enters the weekend in a quiet, range-bound mode, with support around $90,500–$88,200 holding firm. While price action remains subdued for now, key resistance levels near $94,100–$107,500 will likely dictate the market’s next major move. Whether BTC resumes its upward trajectory or tests deeper support, the coming week could provide the confirmation the market has been waiting for.
Expect Slower Bitcoin Market Moves
According to Kamile Uray, the market has entered the weekend, a period typically characterized by slow and subdued price action. The key support region between $90,588 and $88,280 has not yet formed a clear bottom, but it continues to prevent a sharper decline.
Related Reading
On the upside, a daily close above the $94,130 resistance would signal that bullish momentum is resuming. If this level is cleared, the next key resistance to watch is in the $98,200–$107,500 range. The $107,500 mark is particularly significant, as a daily close above it would represent the first higher high relative to the last downward wave on the daily chart, potentially opening the door for further upward continuation.
Should the market face deeper declines, there are multiple support zones to monitor: $86,398, $83,822, and $82,477. As long as BTC holds above $82,477, any pullbacks are likely to be considered retests of previous breakouts, keeping the broader bullish scenario intact.
If BTC closes below $82,477, it could trigger a continuation of the downtrend, possibly testing the $74,496–$71,237 zone, which represents a strong support area. Once a clear reversal is confirmed from this region, an upward move targeting the downtrend line could follow, offering a potential opportunity for traders to re-enter the market.
Weekend Choppiness Expected As Volume Remains Light
In a more recent update by Lennaert Snyder on X, Bitcoin has entered its weekend liquidity phase. As usual, trading activity is expected to be muted due to weak weekend volume. Looking ahead to next week, Snyder noted that the best-case scenario would be a break above the monthly open in the next weekly candle.
Related Reading
Snyder is monitoring key triggers for quality trades. Historically, Sunday “scam-pumps” have provided opportunities to execute short trades near liquidity zones. Currently, the $87,600 monthly open is viewed as the main target for potential downside.
A diagonal line drawn on the chart highlights buy-side liquidity from shorts, which could be swept before a market structure break (MSB) forms, allowing shorts to be executed. If Bitcoin climbs above the current weekly high near $94,700, Snyder notes that the setup would simply wait for the next MSB to enter shorts again.
Another key resistance to watch next week is around $96,500. A clean break above this level would invalidate the bearish thesis targeting the monthly open, signaling that upward momentum could dominate.
Featured image from Pixabay, chart from Tradingview.com
Good Morning, Asia. Here’s what’s making news in the markets:
Welcome to Asia Morning Briefing, a daily summary of top stories during U.S. hours and an overview of market moves and analysis. For a detailed overview of U.S. markets, see CoinDesk’s Crypto Daybook Americas.
Crypto markets are starting the year in recalibration mode rather than retreat, with bitcoin consolidating above $90,000 and ether regaining relative strength as institutional positioning resets.
As Hong Kong began its Wednesday trading day, BTC slipped modestly on short-term frames but remained range-bound after clearing the psychologically important $90,000 level.
“With stocks, gold and other precious metals at all time highs, we see the situation as a battle between price correcting higher to be in line with all the other assets vs price moving lower over the next few months to respect the 4-year cycle,” George Mandres, a crypto analyst at trading firm XBTO, told CoinDesk in a note, adding that the latter “can very quickly turn into a self-fulfilling prophecy.”
So far, neither force has dominated price action. Instead of a sharp correction, bitcoin has moved sideways, suggesting digestion rather than distribution. Mandres pointed to the calendar effect as a key difference from late 2025.
“What is different now vs a few weeks ago, besides the [btc] price, which has gone above $90k, is the fact that a new year has started and therefore PNLs reset to 0, and investors need to allocate capital to attractive risk/reward opportunities,” he continued.
Ethereum tells a slightly different story. While ETH has outperformed bitcoin over weekly and monthly windows, futures data suggests positioning has cooled.
Bradley Park, founder of DNTV Research, said CME ethereum futures open interest offers useful context beyond spot charts.
“Rising open interest has increasingly reflected institutional participation via DAT-style, ETF arb trades, while falling open interest suggests an unwind,” Park said in a note to CoinDesk.
That unwind now appears well advanced.
“The recent pullback looks less like a structural break and more like a loss of momentum, with positioning resetting to roughly July 2025 levels,” Park added.
Importantly, that reset has not been accompanied by a sharp spot selloff.
A recent report from Glassnode reinforces the same theme across assets. Options markets have de-risked aggressively, with open interest contracting and volatility expectations rising, while U.S. spot ETF flows have flipped back to net inflows, signaling renewed institutional demand but also increasing sensitivity to near-term profit-taking.
Taken together, the signals point to consolidation and rotation rather than a broad risk-off move. Bitcoin is absorbing competing macro narratives without breaking trend, while Ethereum looks less crowded and better positioned if institutional flows re-engage.
Market Movement
BTC: Bitcoin is trading sideways above $90,000, with price action reflecting consolidation after a recent advance rather than renewed selling pressure, as macro support and cycle-driven caution continue to offset each other.
ETH: Ether is trading around $3,247, edging lower on short time frames but remaining up strongly on weekly and monthly views, underscoring resilience despite a recent cooling in futures positioning.
Gold: After a nearly 65% rally in 2025, banks see gold pushing to new records in 2026 on falling rates, central bank buying and geopolitical risk.
Nikkei 225: Japan’s Nikkei 225 fell 0.45% on Wednesday as Asia-Pacific markets traded mixed, with Australia’s ASX 200 rising 0.38% after inflation data came in below forecasts.
Elsewhere in Crypto
- DeFi, ethics disputes remain in Senate crypto bill ahead of Jan. 15 vote (CoinDesk)
- Rapper Drake Faces RICO Lawsuit for Promoting and Using Crypto Casino Stake (Decrypt)
Bitcoin models show a 70% chance of a massive 2026 breakout, but only if this trend holds
On a cold ‘Betwixmas’ December morning, the mood around Bitcoin feels familiar and strange at the same time.
Familiar, because the story still swings between euphoria and anxiety. Strange, because the people watching the chart now include a different crowd.
Market Cap $1.74T
24h Volume $43.03B
All-Time High $126,173.18
Some are still the veterans who lived through 2017 and 2021, some are newer, the ones who got exposure through a brokerage account and an ETF ticker, the kind of investor who never had to learn what a seed phrase is.
Bitcoin is trading around $89,000. That number would have sounded ridiculous a few years ago, and it still does if you zoom out. Yet it also feels like a comedown, because only weeks ago, the market was living through a peak near $126,000 and then the fall that followed.
That drop was pinned, in part, on rising Treasury yields, tariffs, and ETF outflows, a reminder that Bitcoin now breathes the same air as the rest of global risk markets.
Which sets up the real point for 2026.
If Bitcoin prints a fresh all-time high next year, after already topping in 2025, it changes the emotional rhythm that people have built their expectations around.
Traders call it the four-year cycle, the halving shows up, supply issuance drops, a big rally follows, then the hangover. Everyone has their own version, but the timing pattern has acted like a metronome.
A 2026 all-time high would be more than another green candle. It would be a signal that the metronome is losing its grip, and that something else is now keeping time.
The old cycle story, and why 2026 is the stress test
The “four-year cycle” idea is built on a clean premise: every halving reduces new supply, the market tightens, price runs, then the cycle exhausts, and a deep drawdown clears out leverage and excess.
Historically, the most prominent peaks often arrived about a year to a year and a half after a halving. In the classic telling, the halving is the match, the rally is the fire, and the second year is where the fire burns out.

Small-cap crypto tokens just hit a humiliating four-year low, proving the “Alt Season” thesis is officially dead
The S&P 500 gained 47% over 2024-2025 while broad alt baskets delivered negative Sharpe ratios with 0.9 correlation to large-cap crypto.
Dec 14, 2025 · Gino Matos
The reason 2026 matters is that it sits on the wrong side of that old calendar. The most recent halving happened in 2024; the market already pushed into new highs before the halving in a way that caught plenty of people off guard, then it pushed higher again in 2025. If Bitcoin goes on to set another meaningful high in 2026, it starts to look less like a neat four-year pulse and more like a longer macro cycle with corrections along the way.
That difference matters for anyone trying to write the next chapter, and it matters for the people whose lives are tied to these moves, the retail holders who measure time in bull markets, the founders who time fundraising windows, the miners who live and die by margins, the institutions that now have to explain their exposure in quarterly letters.
A simple bar to clear, and what the math says it takes
Bitcoin would need to take out the prior high near $126,000. From roughly $89,000 today, that is about a 42 percent climb.
That is not a moonshot by Bitcoin standards, it is also not free. In plain compounding terms, the market would need something like 3 percent a month on average to get there by the end of 2026, or closer to 6 percent a month to do it by mid-year.


Bitcoin crosses $126,000: Why BTC hit a new all-time high this week
Bitcoin faces record institutional demand and macroeconomic uncertainty, key drivers converging to push it to new highs.
Oct 7, 2025 · Gino Matos
Real markets do not move in smooth lines, but the math is useful because it tells you what the hill looks like before you start arguing about weather.
When you ask what needs to happen for that climb to be plausible, you end up back at three forces that have become harder to ignore over the last two years.
Rates, flows, and access.
- Rates, because the market has already shown it can punish Bitcoin when real yields rise, a non-yielding asset has to fight for attention when investors can get paid to sit in cash.
- Flows, because ETFs and ETPs have turned Bitcoin into something that can be bought and sold in size without touching a crypto exchange, and that means a single week of institutional risk-off behavior can now matter.
- Access, because the next wave of demand is increasingly about distribution, platforms, compliance rails, and whether Bitcoin is a single click away inside the systems people already use.
Those three factors are also the most legible way to talk about a cycle break without turning it into astrology.
The supply and demand story that actually moves price
After the 2024 halving, the network creates about 450 new Bitcoin a day. At roughly $89,000 per coin, that is about $40 million of new supply value per day, around $15 billion over a year at current prices.
This is not a perfect proxy for sell pressure. Miners do not sell every coin, and long-term holders and exchanges add their own dynamics. Still, as a back of the envelope reality check, it works.


Bitcoin halving cuts production, sinks revenues for top miners
Stronghold Digital Mining reported a 47.1% decline in monthly Bitcoin mining output in May, attributing it to the post-halving.
Jun 8, 2024 · Mike Dalton
If the market wants higher prices, someone has to absorb supply, and the absorption has to be persistent enough to matter. This is where the ETF era becomes the core of the 2026 debate.
Citi’s forecast for 2026 puts a price target around $143,000, and it includes a rough expectation of around $15 billion in ETF inflows. Whether you agree with that target or not, it gives a useful way to frame the year, because that flow number is on the same order of magnitude as a year of post-halving issuance value.


If ETFs, corporates, and other allocators collectively bring in net new demand that matches or exceeds the flow of new supply for long stretches, a new all time high becomes a plausible outcome without requiring a retail mania. If flows stall, or reverse, then Bitcoin has to climb while fighting both gravity and its own reflexes, and the odds shift.
CoinShares data shows that the ETP market is already large enough to leave fingerprints. There have been strong inflow weeks, the yearly total in 2025 still looks big in absolute terms, and the drawdowns in AUM show how quickly risk appetite can change.
So 2026 becomes a year where the question is less about whether Bitcoin’s code will keep doing what it always does, and more about whether the people and institutions around it keep choosing to hold, add, and distribute it.
A rates regime that stops punishing Bitcoin
Picture the kind of investor who used to scoff at Bitcoin, then quietly bought exposure through an ETF when it became administratively easier.
That person is not usually thinking about halving cycles, they are thinking about opportunity cost, correlation, and what their portfolio gets paid to do while it waits.
Real yields have been a major part of the story in late 2025, and the narrative around the price drop after the October peak leaned on rising Treasury yields alongside ETF outflows. In that world, Bitcoin trades more like a high-beta asset, and it’s treated as optional when the safe alternative pays.
For Bitcoin to print a new high in 2026, you would usually expect at least one of two things to change.
Either real yields stop rising and start easing, which makes non-yielding assets easier to own, or Bitcoin’s demand becomes strong enough that it shrugs off higher yields.
The first path is the cleaner one, and it is the more traditional macro setup for risk assets and alternative stores of value. The second path is the one that would truly feel like a regime shift, and it likely requires something bigger, broader access, more persistent institutional accumulation, and a market that has absorbed the ETF structure into its normal functioning.
Access as the quiet catalyst
The most underappreciated part of the last two years is how much the buying process has changed.

Bitcoin used to require friction. You had to sign up somewhere, learn a new interface, and accept a kind of personal responsibility that most investors did not want. That friction served as both a demand limiter and a safety barrier.


Crypto insiders stopped buying new tokens 2 years ago, creating a liquidity trap that’s crushing retail buyers
With 2025 marking drastic valuation drop-offs, token launch strategies face scrutiny for prioritizing unicorn dreams over practical fundamentals.
Dec 24, 2025 · Oluwapelumi Adejumo
Now the friction is lower. ETFs have made it easier to buy, and the next step is for brokerages and banks to go further, which Reuters reporting suggests is exactly what parts of Wall Street are exploring. If spot crypto trading becomes embedded inside mainstream brokerage platforms, the number of potential marginal buyers expands again, including people who will never open a crypto exchange account.
This matters for 2026 because access can change the shape of demand.
Retail manias tend to be bursty, you get a flood, then a drought. Allocations through familiar financial plumbing can be slower, stickier, and more boring, which is also another way of saying it can extend a trend and stretch timing expectations.
A cycle break does not have to look like fireworks, it can look like a grind.
A plausibility model, in plain terms
Here is the part most cycle arguments skip, probability.
We can model Bitcoin’s chance of touching a new all-time high with a simple approach that traders and risk managers have used for decades, a stochastic process where price wiggles with volatility, and drifts upward or downward based on the expected return environment.
You can debate the assumptions, and you should, but it gives a disciplined way to talk about outcomes.
Using today’s price near $89,000, an all-time high barrier at $126,000, and an annualized volatility estimate around 41 percent from CF Benchmarks’ BVX, we can plug in a drift assumption based on a real-world forecast, Citi’s $143,000 target for 2026 implies a positive drift consistent with that year-end level.


With those inputs, the model gives a probability in the rough neighborhood of 70 percent that Bitcoin touches a new all-time high at least once during 2026.
That is a conditional statement, and it says something important.
With volatility this high, Bitcoin does not need an immaculate rally path to print a new high, it needs enough positive drift so that the random swings have a favorable bias.
Then we can extend the horizon out to the estimated 2028 halving window. Under the same drift assumption, the probability that Bitcoin fails to print a new all-time high at any point before the 2028 halving falls into single digits.
If you assume a more conservative path, strong momentum in 2026 followed by a cooler, consolidating 2027 into early 2028, that failure probability rises into the mid-teens.


The “no new high before the next halving” outcome is possible, and it becomes meaningfully more likely if 2027 turns into a risk-off digestion year. The market’s base case, under optimistic drift assumptions, still leans toward another high before 2028.


Why is everything dumping? Mixed treasury auction results point to risk-off
The stop-out yield at 4% came in above the median of 3.97%, signaling investors demanded higher compensation to hold short-dated government debt.
Oct 7, 2025 · Gino Matos
So what has to happen in 2026 for the cycle to feel broken
If you strip away the jargon and keep it grounded, the conditions look like this.
- The flow regime needs to turn supportive again. Sustained net inflows through ETFs and other ETPs, and a return of confidence after periods of outflows, with enough consistency to offset new supply and entice sidelined capital back in.
- The macro backdrop needs to stop acting like an anchor. Ideally, real yields stabilize or fall, and the market’s appetite for risk assets returns in a way that supports high beta exposures.
- Access needs to keep expanding. Broker platforms, banks, and the broader distribution layer matter because they expand the buyer base without requiring a cultural conversion. This is the boring infrastructure story, and it is often the story that changes market structure.
- Regulation needs to feel clearer. The U.S. stablecoin framework and Europe’s MiCA era both point toward a world where crypto operates inside more defined rules. Clarity can scare off some behavior, it can also unlock a larger pool of capital that was waiting for rules it can live with. In 2026, that unlock matters more than slogans.
- Bitcoin’s scarcity narrative gets a new milestone. The approach toward 20 million coins mined lands as a psychological marker for a market that is always searching for symbols. In earlier cycles, the halving date was the symbol. In a more mature cycle, milestones can stack, and the story becomes a long arc rather than a single calendar event.
Put those together, and a 2026 all-time high stops sounding like a magical break of fate; it starts sounding like an extension of a structural shift that began when the market moved on chain demand into traditional financial wrappers.


CryptoQuant CEO revises bearish market outlook, says cycle theory evolving with institutional inflows
New players with long-term horizons are stabilizing Bitcoin’s market, reducing volatility and changing traditional cycle patterns.
May 9, 2025 · Assad Jafri
What we might expect as we head toward the 2028 halving
If Bitcoin does break out again in 2026, the next phase becomes the more interesting one.
In the old cycle script, 2027 would be the year where the air comes out, the market bleeds, and everyone waits for the next halving like a scheduled sunrise.
A cycle break changes that emotional pacing.
It changes the context. Corrections become something you manage inside a broader trend rather than something that ends an era.
A reasonable expectation, if 2026 prints a meaningful new high, is that 2027 turns into a consolidation year rather than a full reset. Volatility can compress as the buyer base becomes more institutional, and the market starts to behave more like a macro asset with crypto-specific catalysts rather than a standalone casino.


Is Bitcoin now a $57B volatility trade – or just the start?
The real Bitcoin market isn’t on spot exchanges anymore.
Oct 7, 2025 · Andjela Radmilac
The halving in 2028 then becomes less of a sudden shock and more of a committee event, a date that asset allocators can plan around, with the story framed as incremental tightening in supply against an expanding access layer.
That kind of market can still rally post-halving, and it can still sell off sharply. The difference is that the driver is no longer only the ritual of the cycle; it is the interaction of liquidity, flows, and risk appetite.
And then 2029, where the story becomes about maturity
If you follow that path out one more step, 2029 starts to look like a year where Bitcoin’s biggest question is identity.
In a world where access is mainstream and regulation is clearer, Bitcoin has to prove what role it plays when the novelty is gone. Some people will keep treating it like digital gold, some will treat it like a levered bet on liquidity, some will treat it like a strategic reserve asset, especially if sovereign signaling continues to evolve.


Fed chair Powell views Bitcoin as digital gold, not a dollar competitor
Powell reiterated his remarks on Bitcoin being used solely for speculative purposes, not being a competitor for the US dollar.
Dec 4, 2024 · Gino Matos
This is where the “human interest” part comes in.
The most important shift is not that the chart breaks a pattern, it is that the people holding Bitcoin may no longer share the same time horizon or the same reasons for owning it.
The retail holder checking price on a phone during a commute, the miner watching margins, the founder building a company, the portfolio manager trying to justify exposure to a committee, they all pull on the market in different ways, and those different ways can smooth the old extremes while still leaving plenty of room for drama.
A 2026 all-time high would be a headline. The deeper story is the slow replacement of a folklore cycle with a more grown-up, more complicated engine.
If the market wants that outcome, 2026 is the year it has to earn it, through flows that stick, a macro backdrop that stops fighting, and access that keeps widening, so that Bitcoin’s next peak feels less like a once every four years event and more like part of a longer, messier march into the mainstream.
At the time of press 11:46 pm UTC on Dec. 26, 2025, Bitcoin is ranked #1 by market cap and the price is up 0.21% over the past 24 hours. Bitcoin has a market capitalization of $1.74 trillion with a 24-hour trading volume of $42.95 billion. Learn more about Bitcoin ›
At the time of press 11:46 pm UTC on Dec. 26, 2025, the total crypto market is valued at at $2.95 trillion with a 24-hour volume of $98.12 billion. Bitcoin dominance is currently at 59.15%. Learn more about the crypto market ›
Bitcoin price has rebounded slightly to $109,600 after yesterday’s dip to $106,000, ending what has been a tumultuous October for bitcoin.
Traders are now cautiously optimistic as the market transitions from the failed “Uptober” rally to the historically stronger month of November.
Yesterday, Bitcoin tumbled over 3% amid renewed risk-off sentiment sparked by Federal Reserve Chair Jerome Powell’s hawkish comments on future rate cuts and renewed U.S.–China trade tensions.
The dip extended a week-long decline that began after the Fed delivered a modest 25 basis point cut but signaled uncertainty for December’s meeting.
Bitcoin price had a disappointing October
Bitcoin entered October with high hopes for “Uptober,” a seasonal trend historically associated with double-digit gains.
Early in the month, Bitcoin briefly touched $125,000, only to give back much of those gains amid macroeconomic jitters and slow institutional activity. On October 10, the bitcoin price dropped sharply to the $108,000 range from $117,000 as the U.S.-China trade tensions and new tariffs triggered a market-wide sell-off.
At its lowest, Bitcoin fell about 10% on that day and other cryptocurrencies dropped 20–40%, though it later rebounded to around $113,000 amid high volatility.
Strategy (MSTR), one of the largest Bitcoin accumulators, bought just 778 BTC in October — down 78% from September — bringing its total holdings to over 640,000 BTC.
Altcoins mirrored Bitcoin’s struggle this month. At times, Ethereum fell below $3,790, while Solana dipped under $187. Despite the weakness, Bitcoin dominance remains steady at roughly 57%, suggesting the market is consolidating rather than capitulating.
Bitcoin price rebound in ‘Moonvember?’
Looking ahead, traders are turning their attention to next month, November — sometimes nicknamed “Moonvember” — which historically follows strong October performances.
Despite macroeconomic pressures, some analysts see potential for Bitcoin to retest all-time highs going into 2026, assuming stable Fed guidance, renewed inflows, and no new shocks.
That being said, bitcoin has traded in an unusually tight range between $106,000 and $123,000 for over four months, pushing volatility to record lows, a pattern that historically precedes major trending moves.
If past fractals repeat, Bitcoin could see significant gains toward $170,000–$180,000 by and through 2026, though sideways trading may persist until macro catalysts like Fed rate cuts or capital rotation spur renewed volatility.
DOGE steadies after a volatile week, grinding higher through Friday as desks see renewed interest from institutional and corporate wallets. Volumes remain heavy, but the tape looks cleaner — buyers defending the $0.188 base with conviction. Traders say positioning is quietly turning constructive into the weekend.
News Background
- DOGE’s rebound comes as broader risk assets stabilize following heavy midweek liquidations. The meme token added roughly 3% in the 24 hours to October 19 08:00, trading from $0.186 lows to a $0.191 peak.
- Market chatter points to new inflows tied to treasury allocation pilots following House of Doge’s Nasdaq debut, drawing early corporate curiosity into crypto balance-sheet exposure.
- Institutional desks flagged a breakout around 17:00 UTC on Thursday as DOGE ripped from $0.187 to $0.191 on 276 million in volume — four times its average.
- That impulse marked the first convincing high-volume bid since last week’s trade-war flush and defined $0.188 as new support.
Price Action Summary
- DOGE’s 24-hour range hit roughly 3% between $0.186–$0.191, with bulls maintaining control through the U.S. session.
- Price action flattened into late Asia hours, with volume tapering — a classic sign of passive accumulation rather than forced liquidation.
- The final hour saw a brief dip to $0.188 before a snap recovery through $0.190 on a burst of 8.7 million in volume, confirming interest from algorithmic buyers defending the line.
Technical Analysis
- Price structure stays constructive above $0.188. Momentum bias turns positive as funding normalizes and short exposure clears.
- A decisive push through $0.192 opens the path toward $0.197–$0.200 — the upper boundary of last week’s distribution zone.
- Failure to hold $0.188 would re-expose $0.182–$0.180 supports, but flow data suggest bids remain firm below spot.
What Traders Are Watching
- Traders are eyeing a clean break through $0.192 to confirm continuation. On-chain trackers show moderate whale inflows resuming after early-month distribution.
- Treasury desk activity remains the wildcard — any follow-through from corporate accumulation could turn this into a sustained base rather than a dead-cat bounce.