Dormant BTC activity fell to its lowest level since Q3 2022, suggesting long-term holders have slowed distribution after heavy profit-taking.
J.P. Morgan’s Kinexys blockchain payments platform has processed more than $4 trillion in transactions since launch and expanded to eight currencies, adding the Australian dollar, Hong Kong dollar, Japanese yen, Chinese renminbi and Singapore dollar to serve institutional clients across Asia-Pacific.
J.P. Morgan’s Kinexys blockchain has crossed $4 trillion in cumulative transactions and added five Asia-Pacific currencies, extending 24/7 settlement to the region’s largest trade corridors.
The bank added the Australian dollar, Hong Kong dollar, Japanese yen, Chinese renminbi and Singapore dollar to its Blockchain Deposit Account network on Monday, bringing the total to eight currencies alongside the existing U.S. dollar, euro and British pound, according to CoinDesk. J.P. Morgan says Kinexys has processed more than $4 trillion in transactions since launch, with average daily volume exceeding $7 billion.
Kinexys uses a permissioned blockchain to settle transfers between institutional clients around the clock. Clients hold deposits at J.P. Morgan that are represented digitally on-chain, allowing near-instant settlement without leaving the bank’s regulated infrastructure. The model is designed to remove the timezone constraints and correspondent-banking queues that slow conventional cross-border payments.
J.P. Morgan also offers JPM Coin, a deposit token issued on Base, Coinbase’s Ethereum Layer 2, for clients that want settlement on a public chain alongside the private permissioned network.
Payoneer, the cross-border payments fintech, is among the first customers using the Australian dollar service. JERA Global Markets, the commodity-trading joint venture of JERA and EDF Trading, is the first to use the Japanese yen account, citing round-the-clock cash access as an operational advantage for energy traders working across time zones.
Kinexys reached $3 trillion in cumulative volume at $5 billion daily as of April 28, per a J.P. Morgan milestones update. Adding roughly $1 trillion in two months, alongside the APAC expansion, puts the platform at a scale few public-chain settlement networks have matched for institutional use cases.
The permissioned model serves only whitelisted counterparties inside J.P. Morgan’s compliance framework, distinguishing it from open stablecoins such as USDC or USDT. That structure is its selling point to regulated institutions: no new counterparty risk, no KYC gap, near-instant settlement inside a banking framework they already operate in. JPMorgan, Citi and Bank of America are also building a shared tokenized deposit network through The Clearing House targeting a 2027 launch, adding another lane for bank-issued digital money that competes with public-chain alternatives.
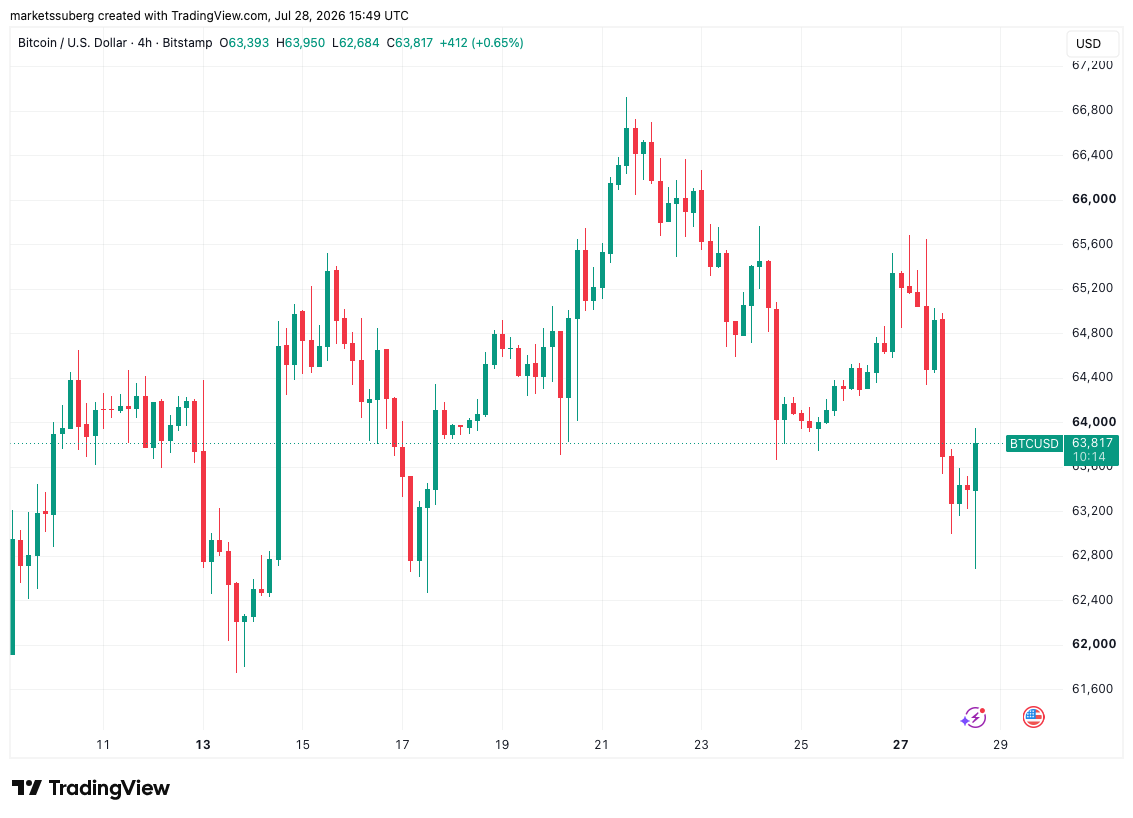
Bitcoin fell below the $60,000 mark on Friday, June 5, 2026, recording its lowest level since the beginning of 2026 as a selloff wave spread across the crypto market. Downward pressure came from a record streak of outflows from US spot Bitcoin ETFs, a repricing of Fed interest rate expectations following a stronger-than-expected jobs report, and a wave of mass liquidations of leveraged positions.
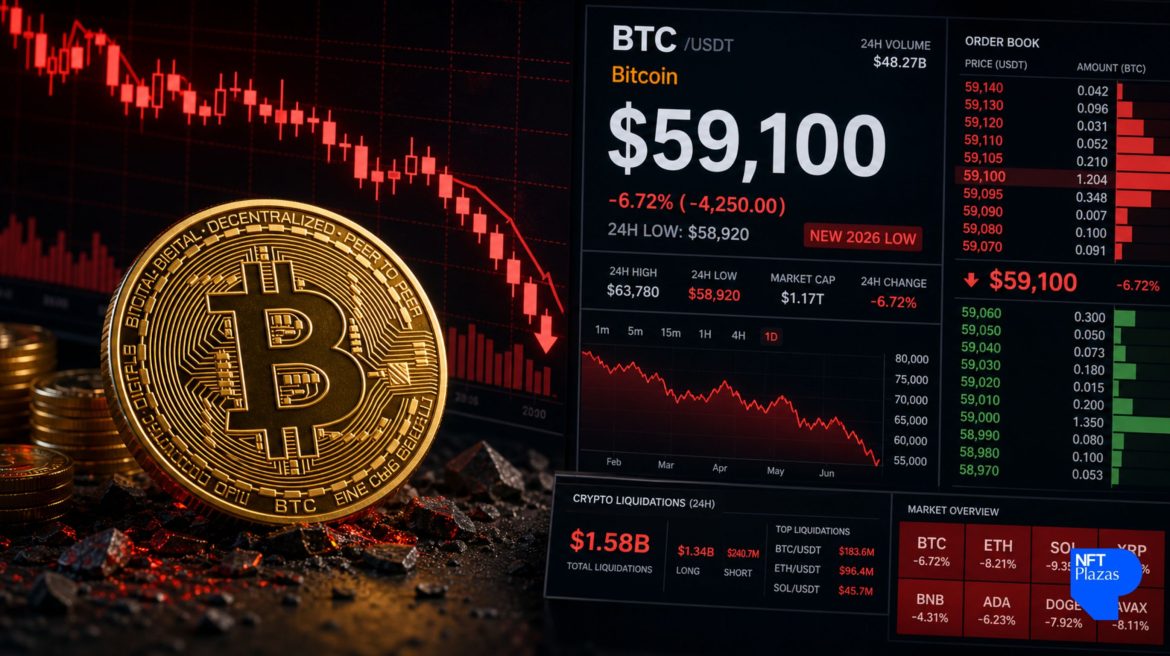
Bitcoin at one point dropped to the $59,100 zone, breaking the $60,000 psychological threshold for the first time since late 2024, according to CoinGecko data. Before slightly recovering, BTC had fallen nearly 20% in just one week, marking one of the asset’s sharpest declines since the start of the year.
BTC price chart (D). Source: TradingView
Selling pressure was not limited to Bitcoin. Ethereum, Solana, XRP, ADA, and many other large-cap tokens also fell sharply, showing that investors are weighing risks across the entire crypto market. Total crypto market capitalization has also decreased by about $600 billion since its peak in mid-May, from around $2.7 trillion to nearly $2.1 trillion by the weekend.
The $60,000 zone is a sensitive milestone for Bitcoin because it is both a psychological threshold and a support zone that appeared before the rally that pushed BTC past $100,000 in late 2024.
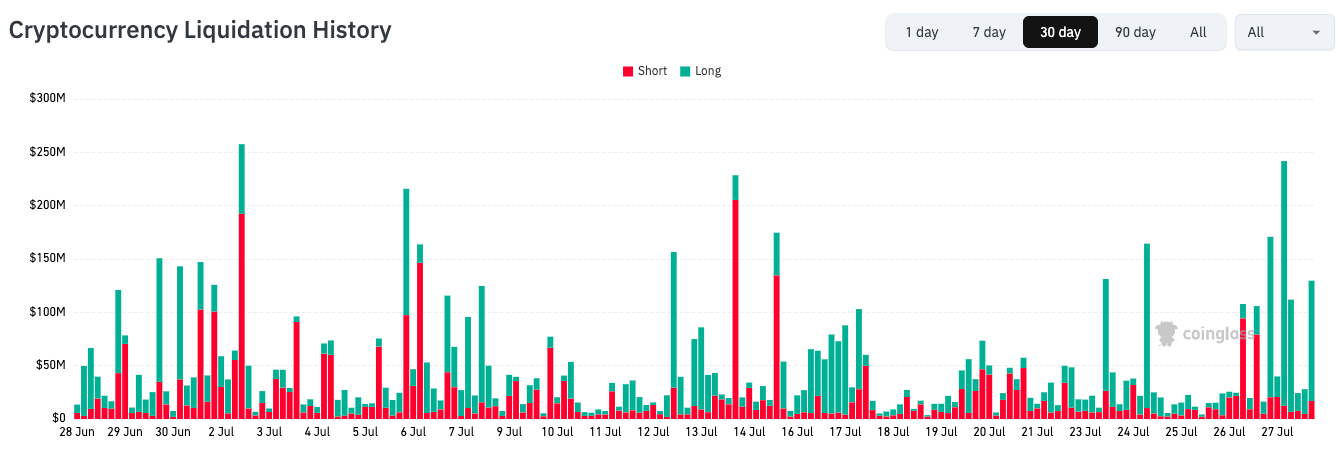
According to CoinGlass data, the crypto market recorded approximately $1.5-$1.75 billion in liquidated positions within 24 hours around the drop, mostly long positions. This shows that the decline did not only come from spot investors selling off, but was also amplified by the derivatives market, where leveraged orders were forced to close when prices went against expectations.
Bitcoin losing the $60,000 mark therefore reflects a broader deleveraging event in the crypto market. As speculative capital flows out faster than the absorbing capacity of new buying power, volatility may continue to remain high even if Bitcoin experiences short-term recoveries.
One of the heaviest pressures came from spot Bitcoin ETFs in the US. According to SoSoValue data, this group of ETFs recorded 13 consecutive sessions of outflows as of June 3, with a total outflow of about $4.4 billion. This is the longest record-breaking capital withdrawal streak since spot Bitcoin ETFs began trading in the US.
This streak of capital withdrawals weakens one of Bitcoin’s most important sources of institutional demand, increasing pressure on the spot market during a risk-off period.
Macro pressure increased following the US May jobs report. According to the Bureau of Labor Statistics, the US economy added 172,000 jobs in May, much higher than expectations of around 80,000-85,000, while the unemployment rate held at 4.3%.
CME FedWatch data showed that the probability of the Fed raising interest rates at least once before the end of the year rose to 67% on Friday, up from 45% a week earlier. For Bitcoin and crypto in general, a high-interest-rate environment is usually disadvantageous because capital tends to leave risky assets.
These pressures did not only appear in the crypto market. US stocks also weakened during Friday’s session, while tech and AI stocks faced selling pressure, dragging down overall market risk appetite.
Market sentiment was also more sensitive after Strategy, a company closely associated with Michael Saylor, sold 32 BTC to net about $2.5 million. This transaction is very small compared to Strategy’s holdings of approximately 843,706 BTC, but it still drew attention because Saylor and his company have long been viewed as a symbol of a long-term Bitcoin accumulation strategy among listed corporations.
Even so, Strategy’s sale was not the main reason for pulling Bitcoin below $60,000. In the context of prolonged ETF capital withdrawals and a market repricing of interest rate risks, this move primarily served as a psychological signal, making investors more cautious.
In the short term, the $60,000-$63,000 zone will be the area to watch. If Bitcoin quickly reclaims this zone, the market may view the recent drop as a short-term liquidity sweep. Conversely, if BTC continues to weaken, selling pressure could expand to lower support zones, especially since the derivatives market still holds many leveraged positions.
ETF capital flows will be one of the most important signals over the next few sessions, alongside the Fed meeting on June 16-17 and subsequent inflation data. Losing this milestone does not yet confirm a new bear market, but it shows that the previous upward structure has clearly weakened.
Key takeaways:
Ether (ETH) plummeted to a 13-month low of $1,540 on Friday, following the bearish trend across the broader cryptocurrency market. Traders now fear a deeper price correction, given weakness in ETH derivatives metrics and heightened risk after a bug was found in the Zcash blockchain.
ETH perpetual futures annualized funding rate. Source: Laevitas
The Ether futures annualized funding rate flipped negative on Friday, indicating increased demand for short positions. Even with ETH trading 67% below its all-time high from August 2025, confidence among bulls has been shattered after $1.28 billion in leveraged longs were liquidated over 5 days.

ETH options premium put-to-call ratio at Deribit. Source: Laevitas
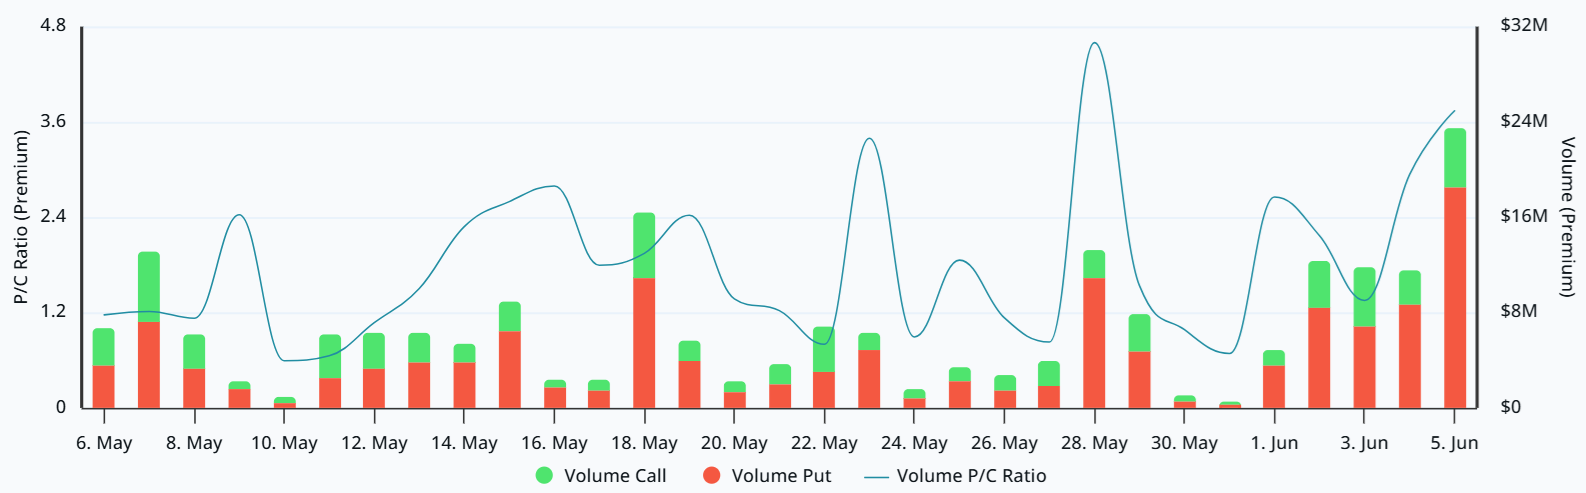
Demand for downside price protection surged as the Deribit ETH options put-to-call premium spiked to 3.7 times on Friday. The indicator has consistently shown excess demand for put (sell) options since Monday. Low conviction among holders fuels uncertainty, giving bears an easy path to take control.
The severe decline in Ethereum network Total Value Locked (TVL) to its lowest since February 2024 has also negatively impacted trader sentiment. Smaller deposits in decentralized applications (DApps) tend to reduce ecosystem revenue, ultimately reducing demand for ETH use in smart contracts.

Ethereum network DApps Total Value Locked, USD. Source: DefiLlama
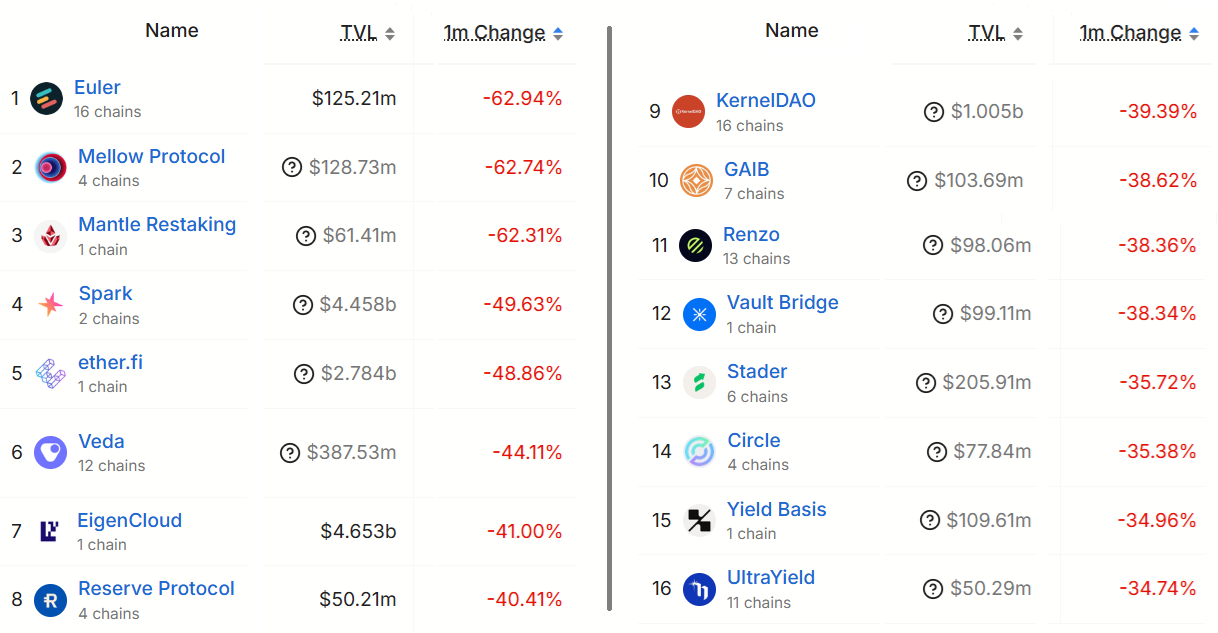
Some of Ethereum’s top DApps experienced severe TVL contractions, including Spark (-50%), Ether.fi (-49%), EigenCloud (-41%), and KernelDAO (-39%). Part of the exodus from smart contracts can be attributed to a critical vulnerability allowing unlimited ZEC minting in the largest ZCash zero-knowledge pool. The bug was found on May 29 using the Opus 4.8 AI model from Anthropic.
Given that the ZCash bug had existed since 2022 without anyone ever detecting it, traders fear that other blockchains and smart contracts could also be at risk. Advances in AI-driven security failure detection have put investors on high alert, especially after cryptocurrency hacks totaled $630 million in April.
KelpDAO’s $293 million hack and Drift Protocol’s $280 million exploit accounted for 82% of the monthly losses across 25 protocols, triggering panic across the decentralized finance (DeFi) industry. The hacks occurred across multiple networks, including Ethereum, Solana, Base, BNB Chain, Sui and PulseChain.

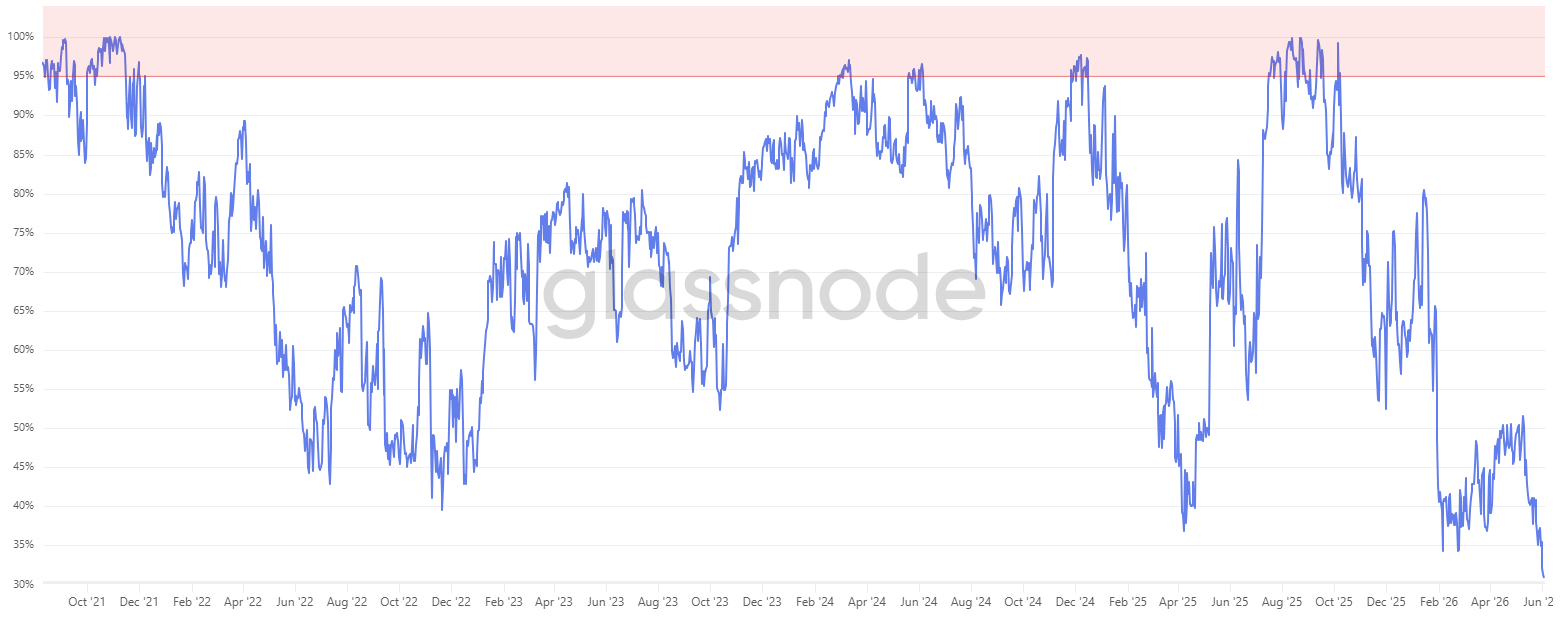
Percent of ETH supply in profit since they last moved. Source: Glassnode
Currently, only 30% of the ETH supply is profitable relative to when those coins were last moved. This setup has occurred only a few times in history, with the most recent instance being the mid-March 2020 COVID crash. Prior to that, this strong buy signal also emerged in mid-December 2019, preceding a 118% rally within 60 days.
Related: FG Nexus offloads additional $17.8M Ether as losses top $100M
With over $500 million in leveraged ETH long positions liquidated in 48 hours, there are no signs of a relief bounce. The largest Ethereum treasury firm, Bitmine (BMNR US), is sitting on an unprecedented $10.5 billion unrealized loss, as the company holds 4.5% of the entire ETH supply.
ETH could slide further below $1,550 as investor confidence deteriorates following multiple hacks across the DeFi industry and the inflationary bug found in the shielded Zcash protocol.
Alvin Lang
Jun 05, 2026 10:09
Solana (SOL)’s ecosystem saw growth in RWAs, ETFs, and stablecoins in May 2026. Despite SOL trading at $66.59, tokenized equities and DeFi volumes hit records.
May 2026 was a pivotal month for Solana (SOL) as it continued its shift toward institutional adoption. The ecosystem saw record-breaking growth in tokenized assets, ETFs, and stablecoins, highlighting its expanding role in decentralized finance and real-world asset (RWA) tokenization. However, SOL is trading at $66.59 as of June 5, down 2.08% in 24 hours, reflecting broader market softness.
Solana’s RWA ecosystem reached an all-time high of $2.8 billion in total value, with tokenized equities dominating 97% of cumulative on-chain trading volume. The network’s stablecoin supply also grew to $16.4 billion, while perpetual derivatives trading hit $64.6 billion in volume—a monthly record, according to DeFiLlama.
U.S. spot Solana ETFs saw $115.3 million in net inflows, with zero outflow days, pushing total assets under management to $1.13 billion by the end of May. Institutional players like Amundi and Spiko Finance expanded their UCITS funds to Solana, while Kraken Custody introduced regulated SPL token custody for institutional clients.
Solana saw a surge in tokenized real-world assets beyond equities, including reinsurance, EV batteries, physical silver, and more. Dominion Market launched asset-backed silver tokens, while Evoracharge tokenized EV batteries after delivering 300,000 kilometers of energy via mobile services.
Meanwhile, consumer-facing RWAs gained traction, with Collector Crypt surpassing $1 billion in platform volume and PSG and AFC fan tokens launching on Solana. This diversification underscores the network’s growing appeal across industries.
DeFi activity on Solana broadened with new fixed-rate markets and yield infrastructure. Kamino’s Ethena market reached $400 million in size within 24 hours of launch, while Jupiter Offerbook introduced borrowing against NFTs and trading cards. However, SOL’s price momentum has weakened as analysts warn of a potential 30% downside after failing to break past $90 in early June.
Additionally, token unlocks scheduled for June 2026, including 624,666 SOL around June 7, are contributing to bearish sentiment. Broader industry-wide token unlocks exceeding $1 billion this month could further weigh on prices.
Institutional adoption progressed with the launch of the first stablecoin issued by a U.S. national bank. SoFi’s SoFiUSD (SoFiD) became available within its app, giving 15 million members direct access. Western Union began rolling out USDPT, its Solana-based stablecoin, while Cash App added USDC support for eligible customers.
These developments reflect Solana’s growing role in payments, with networks like MoonPay and WalletConnect integrating Solana-native infrastructure for merchant and consumer use cases.
Despite strong ecosystem metrics, Solana has faced challenges in 2026. Monthly active users fell to 34.1 million, total value locked (TVL) dropped to $5.5 billion—down 56% from its August 2025 peak—and fees have halved year-to-date. However, the network’s ongoing technical upgrades, such as the ‘Alpenglow’ consensus protocol tested in May, aim to improve finality and throughput, potentially attracting more developers and institutional users.
Solana’s May performance underscores a shift from retail-driven speculation to institutional-grade infrastructure. The record RWA value, robust ETF inflows, and expanding stablecoin ecosystem point to sustained growth. However, SOL’s near-term price outlook remains uncertain amid token unlocks and declining DEX volumes. June 2026 could be a volatile month for traders, with potential catalysts including the Alpenglow upgrade rollout later this year and broader macro trends.
Image source: Shutterstock
XRP slid to its weakest level in more than three months as heavy selling overpowered signs of exchange outflows, leaving the market stuck between two competing signals. Tokens moving off exchanges usually point to accumulation, but price action is saying sellers still have control whenever XRP tries to recover.
• More than 25 million XRP left exchanges after a large inflow earlier in the week, suggesting some investors used the drop to move tokens into longer-term storage.
• Spot XRP ETFs recorded fresh inflows, bringing cumulative flows to about $1.42 billion, though that demand has not yet been enough to reverse the downtrend.
• Leverage was heavily flushed during May, with most high-risk long positions already liquidated as XRP bounced from the $1.28 area.
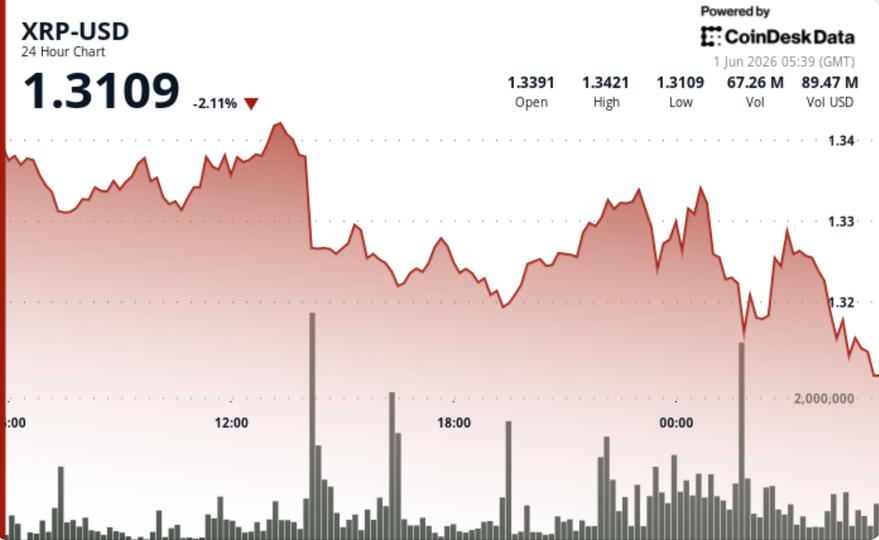
• XRP dropped from $1.3384 to $1.3208, hitting a 15-week low during the session.
• The key breakdown came on 55.03 million in volume, which pushed price through support near $1.3320.
• Selling later extended toward $1.314 before a modest bounce brought XRP back toward $1.32.
• The key issue is that accumulation signals are not yet showing up in price. Exchange outflows are constructive, but XRP continues to get sold into recovery attempts.
• The breakdown below $1.3320 keeps the short-term structure weak, with $1.34 now acting as the first level buyers need to reclaim.
• A large short-liquidation cluster sits between $1.34 and $1.40, meaning a sharp move higher is possible if XRP can break back into that range.
• Until then, the tape remains defensive, with sellers still controlling the lower highs.
• $1.31 is the immediate support. Losing it would put $1.28 and then $1.20 back in play.
• $1.34 is the first recovery level. A reclaim could trigger momentum toward $1.37 and $1.40.
• The setup is unstable because exchange outflows point one way while price action points the other. One side will have to give.
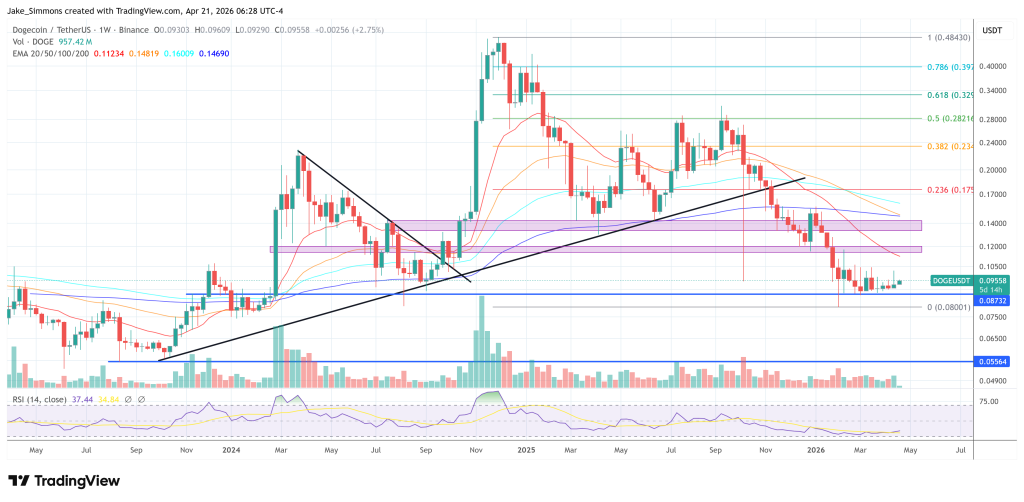
Crypto analyst Kevin, known online as Kev Capital TA, said he has started buying Dogecoin again after the memecoin fell back to what he described as a major long-term support zone near $0.095. In a video published April 20, Kevin argued the level matters because it aligns with the measured move target of Dogecoin’s weekly bear flag and with a price area that has repeatedly acted as both support and resistance across prior cycles.
Kevin said Dogecoin’s corrective move from its December 2024 cycle high near $0.49 has now largely fulfilled the downside target he had been watching for months. “If you just take the measured move target of the bear flag pattern, you’re basically sitting at the exact same price of what the measured move target is,” he said, placing that target at about $0.095.
That level, in his view, is not just a technical target but a historically important zone. Kevin pointed back to August 2024, when Dogecoin bottomed near the same area before rallying sharply in the fourth quarter, and to earlier periods in 2022, 2023 and early 2024 when the band acted as resistance, support, or a breakout-retest level. “This is a major level, right? This is a major major zone,” he said. “You found support here back in January 2024 before we legged up to the 23 cents level. You found the support here again in the summertime of 2024 before we legged up to 49 cents.”
Even so, Kevin stopped well short of calling a confirmed macro bottom in Dogecoin. His broader framework remains centered on Bitcoin, which he repeatedly described as the market’s primary signal. “Altcoin charts are not living in their own world,” he said. “Bitcoin is the captain. Bitcoin is the king. Bitcoin is the queen. Whatever way you want to put it, whatever way you want to slice and dice it, that’s the way the market goes.”
That point shaped the rest of his Dogecoin thesis. Kevin said he has started a position at current levels, but only as part of a gradual accumulation plan that depends heavily on how Bitcoin behaves in the weeks ahead. “I have in our private group started a position in Dogecoin down at these levels,” he said. “My plan is to continue to allocate into it if I get the opportunity to. If Bitcoin were to leg lower … then I would hope to get the opportunity to then slowly, very slowly allocate into Dogecoin all the way down into this $0.08, $0.07, $0.06, maybe $0.05.”
His near-term read is constructive, but only in a limited sense. He pointed to improving weekly money flow, buy signals, upside movement in weekly stochastic RSI, and a bullish turn in LMACD on lower time frames as evidence that the market is in a late-winter, early-spring countertrend rally. But he argued Dogecoin still faces a heavy technical ceiling before traders can talk about a real trend reversal.
On the weekly chart, Kevin said Dogecoin needs to reclaim the 21-week EMA and 20-week SMA around the low-$0.11 area, while higher resistance bands sit around $0.136, $0.147 and $0.161 depending on the moving average used. On the monthly chart, he said the picture is even less convincing. Dogecoin, according to Kevin, closed below the 100 EMA on the monthly for the first time in its history, while monthly momentum, money flow and LMACD have yet to show the kind of reset he associates with the end of a bear market.
“Treat it as a bear market for now,” he said. “This countertrend rally is nice, but for now, it’s still just a countertrend rally on the crypto market until proven otherwise.”
That leaves Dogecoin in a familiar place: attractive enough for selective accumulation, but still dependent on Bitcoin to validate any broader reversal. Kevin said he expects the “true bottom” for the cycle to arrive sometime between July and October if the standard four-year pattern continues. Until then, his message was less about chasing Dogecoin itself than about watching the asset that still sets the tone for everything around it.
At press time, DOGE traded at $0.09558.

Featured image created with DALL.E, chart from TradingView.com
Coinbase chief legal officer Paul Grewal said the CLARITY Act could be nearing a markup hearing in the Senate Banking Committee, but he tied that progress to one unresolved issue: the dispute over crypto and stablecoin yield.
That came as the broader push for the bill picked up new urgency from lawmakers and industry figures who fear the window for action is closing fast.
US Senator Cynthia Lummis said the country may not get another serious shot at the bill before 2030.
In a post on X on Friday, she said this was the “last chance” to pass the CLARITY Act until at least that year and warned against letting the country’s financial future slip away.
This is our last chance to pass the Clarity Act until at least 2030. We can’t afford to surrender America’s financial future.
— Senator Cynthia Lummis (@SenLummis) April 10, 2026
Her warning landed at a sensitive moment. Industry participants have grown more uneasy about the bill’s prospects this year, with November midterm elections threatening to shift congressional priorities and slow work on crypto legislation.
Lummis’ comments framed the fight as one that cannot sit on the shelf much longer.
David Sacks, the former White House AI and crypto czar, echoed that view a day earlier. He said Senate Banking, followed by the full Senate, should pass market-structure legislation and said he believes US President Donald Trump would sign it into law.
The GENIUS Act, signed by President Trump last year, established U.S. leadership on stablecoins.
The CLARITY Act, also known as market structure legislation, would do the same for all other digital assets by providing clear rules of the road.
Secretary Bessent is right: the… https://t.co/rBkE9b5Usq
— David Sacks (@DavidSacks) April 9, 2026
The pressure is not coming from lawmakers alone. Chris Dixon, a16z Crypto’s managing partner, said rules that are clearly defined help both consumers and entrepreneurs.
That line has become a common argument inside the industry, where many firms say clearer oversight would help the US pull in more innovation and more retail demand for crypto assets.
That view has spread across different corners of the sector. Immutable founder Robbie Ferguson said on April 3 that the CLARITY Act could make the past decade of gaming growth look small by comparison.
Coinbase CEO Brian Armstrong also shifted his tone on Friday, saying it was time for the bill to move after months of delays.
Even with that momentum, a key problem remains. Grewal said on April 2 that the bill may be close to a Senate Banking Committee markup, but he also said the path forward depends on agreement over stablecoin yield.
That issue has kept the legislation from moving cleanly, even as support has built among companies and some regulators.
Regulators are now adding their voices too. SEC Chairman Paul Atkins said the time had come for Congress to move market-structure legislation to Trump’s desk and to protect the system from what he called rogue regulators.
The CLARITY Act has since become a test of whether Washington can settle crypto rules before the political calendar closes in.
Featured image from Unsplash, chart from TradingView
Editorial Process for bitcoinist is centered on delivering thoroughly researched, accurate, and unbiased content. We uphold strict sourcing standards, and each page undergoes diligent review by our team of top technology experts and seasoned editors. This process ensures the integrity, relevance, and value of our content for our readers.
The heavy use of leverage means that any position adjustment or liquidation event could hugely amplify ETH’s volatility.
Ethereum open interest has climbed close to the all-time high of 7.8 million ETH set in July 2025.
At the same time, the ratio of spot trading to futures trading on Binance has dropped to its lowest annual level ever.
The above data was shared by on-chain analyst Darkfost in an April 6 post on X. Per the post, Ethereum’s open interest, which had dropped to around 5 million ETH in October last year, has since gone up by nearly 3 million to 7.8 million ETH. About 36% of that activity is concentrated on Binance, translating to roughly 2.3 million ETH.
But the spot-to-futures volume ratio was the more telling data, as it now sits at 0.13 on Binance, the lowest figure ever recorded.
“In practical terms, this means that futures volumes are now about seven times larger than spot volumes,” the analyst explained. “In other words, for every $1 traded on the spot market, roughly $7 flows through futures contracts.”
The current situation is “difficult to interpret,” according to Darkfost. That, he says, is rarely a good sign. While geopolitical and economic uncertainties stemming from the ongoing conflict between the U.S. and Israel on one side and Iran on the other have made investors more cautious, the high activity on Ethereum’s derivatives markets means that speculative participants aren’t holding back.
ETH is back above $2,100, having gained nearly 5% in the last 7 days and slightly more than that in the last 24 hours per CoinGecko data. But the market watcher insisted that most of this recent uptick had been driven by speculation rather than organic demand. However, he cautioned that the extensive use of leverage made for a weak structural foundation, which can amplify volatility in case traders adjust their positions or get hit by a liquidation event.
While Darkfost worried about Ethereum’s spot and futures trading, their effect on the cryptocurrency’s price could potentially play out within a scenario described by fellow analyst Ali Martinez.
The chartist outlined several price zones that traders are watching closely, describing the $1,800 level as a critical support area within a possible ascending triangle structure. This level matches up with the 0.80 MVRV band near $1,880, which reflects periods when many holders are at a loss and selling pressure tends to ease.
If the current structure moves into a wider channel, he said, it could drop to $1,550 and $1,070. On-chain data shows that there were clusters of buying activity at $1,584, $1,238, and $1,089, which would act as support if prices drop.
On the upside, the $2,500 level remains a key threshold. According to Martinez, a sustained move above that point would signal that the average holder is back in profit and could open the door for a larger upward move.
LIMITED OFFER for CryptoPotato readers at Bybit: Use this link to register and open a $500 FREE position on any coin!
Kalshi posted a new record $3.40 billion notional volume week as Polymarket’s sports volume surged 32% week over week with NCAA basketball tournaments in full swing.
The numbers prediction market watchers had been anticipating since Selection Sunday finally arrived last week. Prediction market industry notional volume hit $6.41 billion for the week of March 16–22, a new all-time high in the DeFi Rate tracking period, driven by back-to-back record weeks from Kalshi and a meaningful surge from Polymarket as Round 1 of the NCAA Tournament tipped off Thursday. The prior combined record, set two weeks earlier, was $5.89 billion.
Kalshi posted $3.40 billion in notional volume, breaking its own single-week record of $2.93 billion set the week prior. Polymarket added $2.54 billion, up 8.5% week-over-week. Together the two platforms generated $5.94 billion, the highest combined weekly total on record. What makes this week different from prior records is that both platforms grew simultaneously, in lockstep with the sports calendar (week one of March Madness).
As our live prediction markets tracker shows, active markets exploded week over week from 309,969 to 455,631 (+145,662 / +47.0%), almost entirely from Kalshi building out its March Madness markets, moving from 274,857 to 419,953 (+145,096).
Kalshi held 57.2% market share on a head-to-head basis with Polymarket, up from 55.6% the prior week. The gap is widest during major sports events, and this week was as sports-heavy as any week outside the Super Bowl.
Kalshi_Vol_M
Polymarket_Vol_M
Kalshi_Tx_M
Polymarket_Tx_M
| Week | Kalshi_Vol_M | Polymarket_Vol_M | Kalshi_Tx_M | Polymarket_Tx_M |
|---|---|---|---|---|
| Feb 9 | $2,428.20 | $1,879.60 | 17.40 | 19.60 |
| Feb 16 | $2,592 | $1,820 | 17.60 | 22.70 |
| Feb 23 | $2,729.40 | $2,400.20 | 18.73 | 24.63 |
| Mar 2 | $2,860 | $2,500 | 20.04 | 26.26 |
| Mar 9 | $2,934.75 | $2,344.27 | 19.75 | 24.67 |
| Mar 16 | $3,396.27 | $2,544.66 | 21.44 | 27.36 |
The more interesting metric is open interest, which moved from $870.0M → $952.0M (+$82.0M / +9.4%) based on our tracking. Kalshi drove the bulk of it: $428.8M → $497.0M (+$68.2M), as traders loaded into both individual game contracts and tournament futures with the start of the NCAA basketball tournaments. Polymarket was relatively flat, $440.1M → $447.8M (+$7.7M). Polymarket US jumped from $1.1M to $8.2M, a small absolute number but a 6.5x move, reflecting sports trading ramping up on the US platform, thanks to NCAA tournament betting interest.
Kalshi’s sports volume jumped 27.5% week-over-week to $2.67 billion, pushing its sports concentration from 71.3% to 78.6% — the highest share since the NFL playoff weeks in January. The driver is straightforward: the NCAA Tournament is the only event on the sports calendar that consistently rivals Super Bowl week in both market count and per-game trading activity, and this year’s tournament delivered immediately.
Kalshi_M
Polymarket_M
| Category | Kalshi_M | Polymarket_M |
|---|---|---|
| Sports | $2,670.23 | $1,222.43 |
| Crypto | $285.29 | $635.67 |
| Exotics | $256.27 | — |
| Politics | $24.96 | $529 |
| Trump | — | $65.73 |
Round 1 and 2 games dominated Kalshi’s top markets for the week. Among the highest-volume matchups: Vanderbilt at Nebraska ($9.9M), Texas at Gonzaga ($7.5M), High Point at Arkansas ($7.5M), Louisville at Michigan State ($7.3M), and TCU at Duke ($6.9M). Kalshi also offers spread and total points markets alongside moneylines for each game — Texas at Gonzaga: Spread drew $1.7M separately, and TCU at Duke: Spread added another $3.2M.
The futures market tells the longer story. Kalshi’s Men’s College Basketball Champion market has accumulated $91.4 million in open interest, with Michigan (21%), Arizona (20%), and Duke (18%) leading. That OI figure, larger than any single weekly top-10 market, reflects traders with positions that run through April 7.
Beyond sports, Kalshi’s Crypto category grew 22.1% week-over-week to $285.3M, and Politics was up 30.3% to $25.0M. The Entertainment category collapsed 87.8% to $7.6M, which was entirely expected, as the prior week captured Oscars Sunday trading volume that has now settled off the board.
Kalshi’s Unknown category dropped 62.2% to $72.8M, which could be from Dune Analytics reclassifying newly created tournament contracts into the Sports category as matchups were confirmed after bracket release.
Polymarket’s $2.54 billion week was driven by a rotation that doesn’t show up clearly in the top-line number. Sports volume surged 32.2% to $1.22 billion, its largest weekly sports total in the tracking period, pushing sports concentration from 39.5% to 48.1%. That’s the closest Polymarket has come to a 50/50 sports/non-sports split since we began tracking category data.
The NCAA Tournament was the catalyst on Polymarket too, though at a smaller scale than Kalshi. The platforms’ top NCAA markets overlapped in teams but not in contract structure: where Kalshi runs per-game moneylines and spreads, Polymarket’s highest-volume tournament market for the week was the 2026 NCAA Tournament Winner futures contract ($2.1M weekly, $980K OI), with Arizona and Michigan co-leading at 20% each, Duke at 17%. Individual game moneylines on Polymarket also drew volume — VCU vs. Illinois ($4.1M) and Texas vs. Gonzaga ($3.1M) were both in the cross-platform top 30 — but Polymarket’s game-level volume runs at a fraction of Kalshi’s for comparable matchups.
The more interesting story on Polymarket is what didn’t happen to politics. Politics and Trump combined fell 11.6% to $594.7M — a real decline in an otherwise up week. The Fed’s March rate decision, which topped Polymarket’s leaderboard last week at $141.9M, has now resolved. What’s replacing it is 2028 presidential positioning: the Republican Presidential Nominee 2028 market led Polymarket’s 7-day volume at $11.6M (J.D. Vance at 37%, Marco Rubio at 27%), and the Democratic Presidential Nominee 2028 market followed at $8.9M (Gavin Newsom at 25%). Both carry substantial open interest — $14.1M and $10.1M respectively — indicating these aren’t short-term event trades but positions traders are holding through the cycle. The 2028 Presidential Election market added another $2.8M in weekly volume with $35.0M in OI, the largest open interest figure on the board.
Culture dropped 47.1% — again, Oscars effect. Crypto was essentially flat at $635.7M (+1.6%), maintaining its position as Polymarket’s second-largest category behind Sports.
Polymarket still dominates in terms of non-sports volume, which is now larger than Kalshi’s non-sports volume by almost 2x: $1.34B versus $726M. As noted in previous reports, the two platforms are serving meaningfully different trader populations at this point. Kalshi is running 78.6% sports this week, while Polymarket is running 51.9% non-sports.
Total industry volume across all Dune-tracked platforms reached $6.41B for the week of March 16–22, up 11.4% from $5.76B the prior week. Kalshi and Polymarket combined accounted for 93.4% of total tracked volume, continuing the consolidation trend that has characterized the past two months.
| Platform | Vol_Mar9_M | Vol_Mar16_M | Vol_WoW_Pct | Tx_Mar9_M | Tx_Mar16_M | Tx_WoW_Pct |
|---|---|---|---|---|---|---|
| Kalshi | $2,934.75 | $3,396.27 | 15.70% | 19.75 | 21.44 | 8.60% |
| Polymarket | $2,344.27 | $2,544.66 | 8.50% | 24.67 | 27.36 | 10.90% |
| Crypto.com | $156.10 | $158.66 | 1.60% | |||
| Limitless | $128.13 | $98.46 | -23.20% | 0.35 | 0.30 | -14.10% |
| Opinion | $77.91 | $128.54 | 65.00% | 0.11 | 0.08 | -31.20% |
| predict.fun | $91.15 | $60.33 | -33.80% | 0.11 | 0.09 | -17.30% |
| Other | $20.62 | $23.51 | 14.00% | 0.24 | 0.35 | 44.50% |
| Overtime | $4.04 | $4.04 | ~flat | 0.01 | 0.01 | -9.30% |
Opinion Markets rebounded 65.0% to $128.5M after five consecutive weeks of decline. It’s worth noting, though, it remains far below its $1.81B peak from late December and the bounce may be noise rather than a trend reversal. Crypto.com held steady at $158.7M (+1.6%). Limitless fell 23.2% to $98.5M and predict.fun declined 33.8% to $60.3M.
On transactions, Polymarket maintained its lead with 27.4M versus Kalshi’s 21.4M, a 56/44 split that has been consistent for months. Total industry transactions hit 49.6M across all tracked platforms, up 9.7% week-over-week.
Note: Comparing smaller platforms over time is not fully reliable given how Dune groups certain platforms — Limitless, Myriad, and ForecastEx have been consolidated under “Other” at various points in the tracking period. Week-over-week changes for these platforms should be treated as directional rather than precise.
Polymarket US generated $5.9M in weekly notional volume, flat versus the prior week despite the NCAA Tournament launch. The platform added 108 active markets to reach 596, with Round 1 game lines now available — but individual contract volume remains in the low five figures for most games. Texas at Gonzaga drew $182.6K on Polymarket US; the same game did $7.5M on global Polymarket and far more on Kalshi.
Open interest grew meaningfully to $8.2M, up from $1.1M the week prior, as NCAA tournament futures accumulated. The volume ceiling for individual US-market contracts hasn’t shifted yet, but the OI growth suggests traders are taking positions rather than just watching.
The Round of 32 runs through Sunday, March 22, and the Sweet 16 tips off Thursday, March 27. Based on Kalshi’s conference tournament performance two weeks ago, where individual games drew $7-10M, Round of 32 matchups involving major programs could easily clear those levels. The games with the most volume potential are the ones pitting high-seeded programs with large national fanbases against credible upset threats. Duke ($6.9M in Round 1 on Kalshi), Michigan ($5.4M), and Texas ($7.5M) are the early indicators of where trader attention is concentrated. The Men’s College Basketball Champion futures market at $91.4M in OI will continue to price in real-time as the bracket tightens.
Longer-term, the question is what Kalshi’s volume trajectory looks like after the tournament ends in early April. The platform has now set back-to-back weekly volume records during the college basketball calendar, following a pattern established during the NFL season. Whether that translates to sustained $3B+ weeks during the NBA playoffs alone, without the tournament’s per-game volume density, is the target number to watch in Q2.
Valerie Cross
Valerie Cross is a reporter, editor, and prediction markets analyst with more than a decade of experience covering legal gaming and emerging financial markets. She joined DeFi Rate in 2026 after reporting on the rise of mainstream prediction markets and previously held senior editorial roles at Prediction News and Catena Media. Valerie holds a BA from Furman University and MA and PhD degrees from Indiana University.