Strive plans fresh funding for bitcoin purchases as TD Cowen sees warrant-related stock pressure easing.


 Live Chat
Strive plans fresh funding for bitcoin purchases as TD Cowen sees warrant-related stock pressure easing.
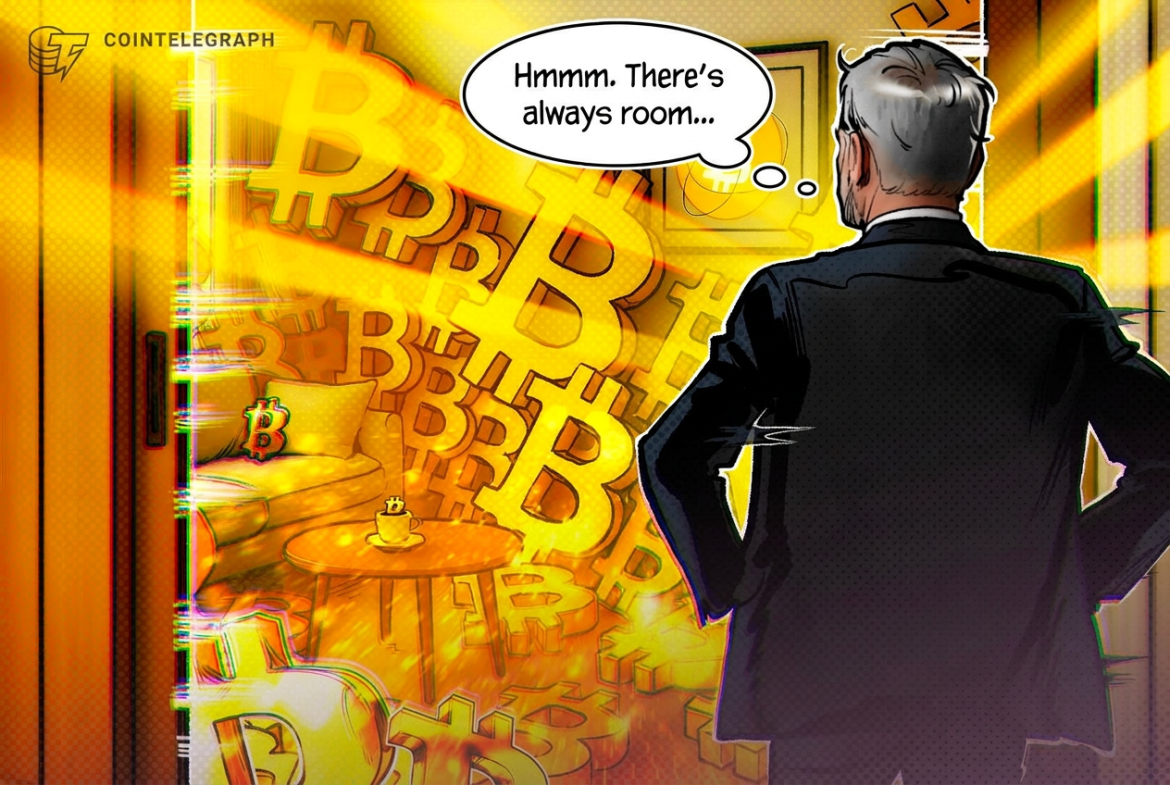
Strategy chair Michael Saylor teased investors watching Sunday for a signal of the company’s recent Bitcoin purchases with the message “There’s always room for more orange,” in a post on X.
However, any official notification via a filing with the US Securities and Exchange Commission won’t likely come before Tuesday, as federal offices will be closed on Monday for the Columbus Day holiday.
Strategy ended September by spending more than six times its weekly Bitcoin (BTC) buying budget on its repurchases of one of its preferred stocks. Strategy bought 334 Bitcoin (BTC) for $28.7 million between Sept. 28 and Oct. 4, bringing its holdings to exactly 848,000 BTC, according to an Oct. 5 8-K form.
Over the same period, Strategy repurchased about 1.77 million shares of its STRC preferred stock for $176.3 million.
To be sure, Strategy’s recent moves could be read as an indication that management can build up cash now and spend it on BTC later.
Independent analyst Shanaka Anslem Perera on Saturday noted that Strategy raised $5.41 billion from new common shares in the third quarter and ended the period with 1,666 more BTC than it held at the end of June.
In his monthly newsletter on Bitcoin and crypto, Perera wrote that Strategy’s SEC filings “allocate 9.5% of the raise directly to bitcoin purchases. Other disclosed uses included a dollar reserve, cash, dividends and preferred-share buybacks.”
“The question for investors is what the financing left behind. For a shareholder, bitcoin per share is only part of the answer. Cash counts too, while debt and preferred shares have claims ahead of common stock,” he wrote.
“During the third quarter Strategy raised billions through share sales, but much supported cash reserves and preferred shareholders. Raising capital does not necessarily mean buying bitcoin,” he told Cointelegraph on Sunday..
“That does not mean they stopped buying BTC. Cash retained can fund later purchases, and strengthening the balance sheet can benefit shareholders.”
Magazine: Former SEC boss made AI Czar, Bitcoin may hit $600K this cycle: Hodler’s Digest
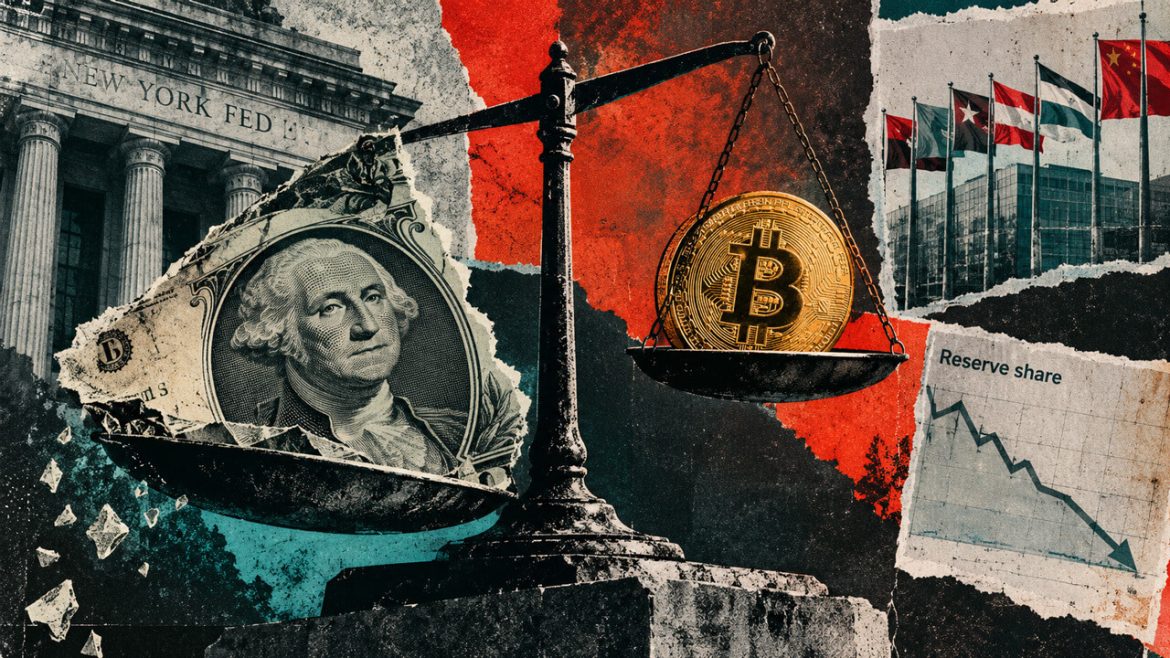
A Sept. 2, 2026 analysis by New York Fed researchers shows how a few large reserve portfolios can lower the global dollar share without a broad retreat from dollars. For investors assessing future sovereign demand for Bitcoin, the distinction is between a changing average and an investment decision.
Linda S. Goldberg, Oliver Hannaoui and Sneha Parthasarathy report that the dollar share of global official foreign-exchange reserves fell from 64% at year-end 2015 to 56% at year-end 2025, using IMF COFER data.
Their country-level evidence points to concentrated decisions and changes in reserve sizes.
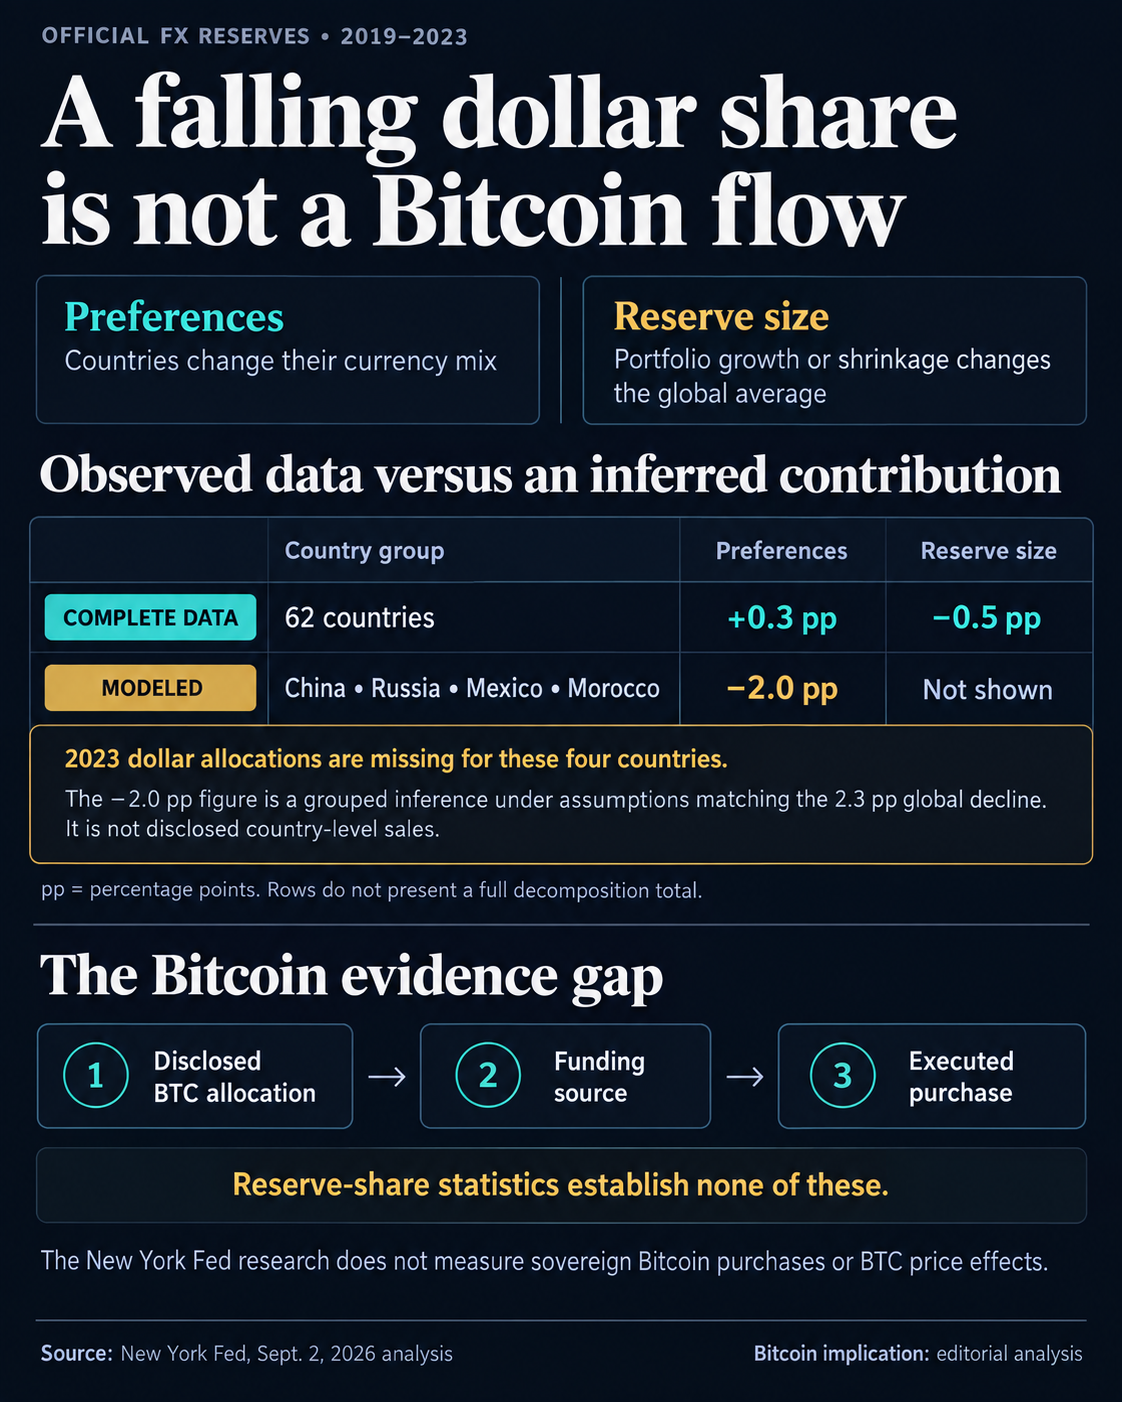
Countries can change the currency mix of their portfolios, the “preferences” channel. Alternatively, their total reserves can grow or shrink, changing their weight in the global average.
When a country with a below-average dollar allocation accumulates reserves, it can pull down the worldwide dollar share without cutting its own allocation. Switzerland did that between 2015 and 2019: its reserve growth pushed the aggregate share down even as its own dollar allocation rose.
For that period, 76 countries had complete endpoint data within a 79-country exercise. Their preferences and reserve-size contributions declined by 1.2 and 1.5 percentage points, respectively.
For 2019-2023, the 62 countries with complete data contributed a positive 0.3 percentage point through preferences and a negative 0.5 percentage point through reserve-size changes.
China, Russia, Mexico and Morocco lacked 2023 dollar-allocation data. Under assumptions matching the observed 2.3-percentage-point global decline, the researchers inferred a combined negative 2.0-percentage-point preferences contribution for that group.
The underlying Staff Report 1087, issued in March 2024 and revised in February 2026, separates reserves needed for liquidity from an investment portion above those needs. Trade payments, foreign-currency debt, and currency stabilization sustain the need for liquid reserves.
The paper models that investment portion using short-term external debt or three months of imports as alternative measures of liquidity needs.
Diversification is more prevalent when reserves can satisfy those needs. Its earlier decomposition covers 2015-2020, while its broader country panel spans 1999–2023.
The distinction also applies when a central bank actually buys Bitcoin. On Nov. 13, 2025, the Czech National Bank announced a $1 million digital-asset test portfolio including Bitcoin, with a dollar stablecoin and tokenized deposit also part of the project.
The amount covered the whole portfolio, and the purchase was explicitly outside international reserves.
Applied to Bitcoin, the reserve research supports a limited inference: diversification beyond liquidity needs does not identify the money’s destination. Neither New York Fed source measures sovereign Bitcoin purchases or estimates a Bitcoin price effect.
A sovereign Bitcoin demand case needs separate evidence: a disclosed allocation, its funding source, and executed purchases, with official reserves distinguished from holdings outside them. A shrinking dollar share supplies none of those details.

Cathie Wood’s ARK Invest bought roughly $77 million of crypto stocks in June, adding $44 million of Coinbase (COIN), $25.25 million of Circle (CRCL), and $8.2 million of Bullish (BLSH) during Bitcoin’s worst month in four years, according to ARK’s daily trade disclosures.
The purchases extend a thesis both Wood and other funds have held through every crypto downturn: public companies offer a regulated, equity-market way to own the digital asset cycle without holding the coins directly.
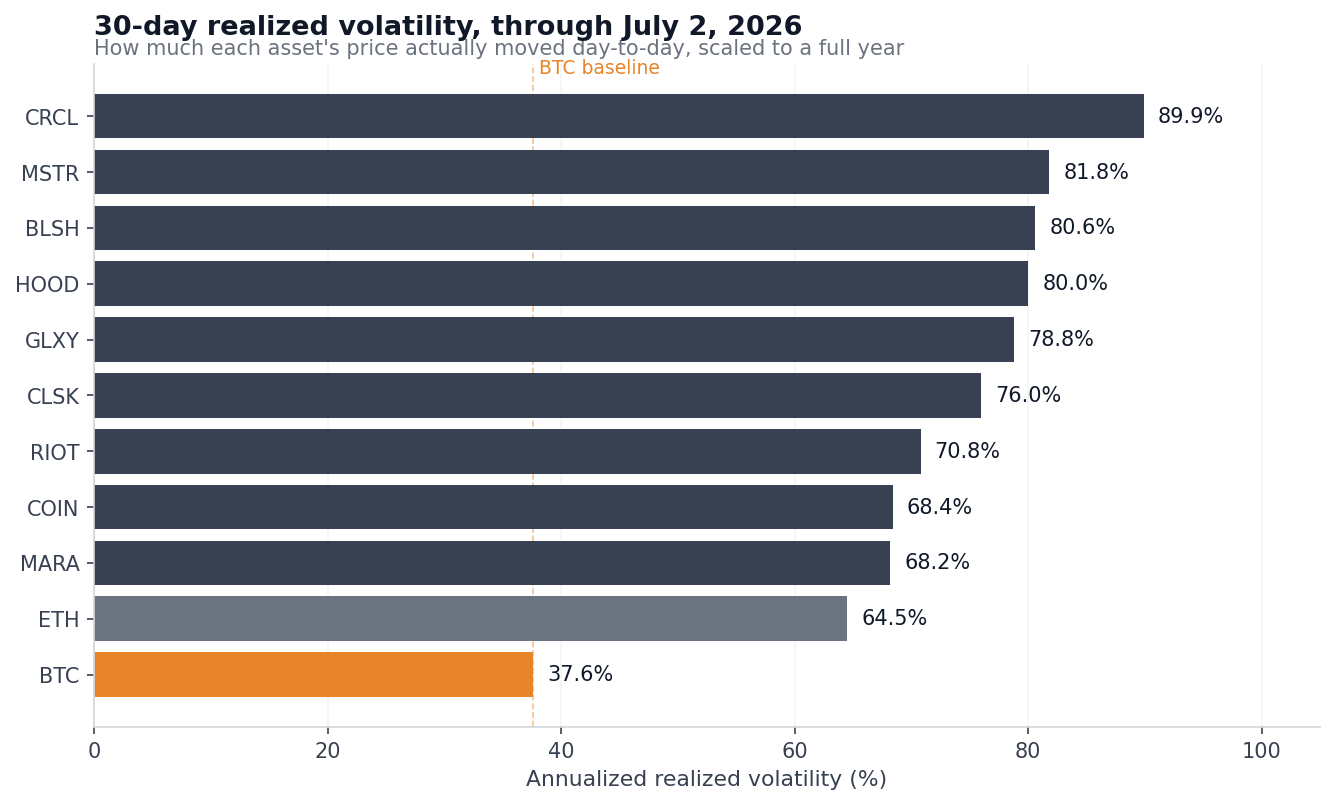
CryptoSlate’s analysis of daily price data through July 2 shows what that equity route actually cost this year. Across nine US-listed crypto stocks, annualized 30-day realized volatility, which measures how much a price actually moved day-to-day, scaled to a full year, ranged from 68% to 90%, roughly double Bitcoin’s 37.6%.
On a 90-day view, Circle’s reading is 103.6%, compared with Bitcoin’s 37.8%. Circle also sits 51.4% below its 2026 high, Strategy (MSTR) 48.6%, and Bullish 43.6%, all steeper falls than Bitcoin’s own 36.4% pullback from its January peak near $97,000.
That volatility gap alone could describe a leveraged Bitcoin bet, but the correlation data points in a different direction. Correlation measures how tightly two assets move together, on a scale from 1.00 (perfect lockstep) down to 0 (no relationship).
Over the last 90 trading days, Circle, Robinhood (HOOD), and Bullish moved in step with Bitcoin, with correlations of only 0.55 to 0.58, meaning Bitcoin’s daily swings accounted for roughly a third of these stocks’ daily moves. The rest is company-specific risk: quarterly earnings, competition, financing, and dilution from new share issuance.
Investors buying stocks for crypto exposure received partial exposure to the coin and, on top, a full second layer of equity-market risk.
Here is the full picture from the price data. Year-to-date returns run from the last close of 2025. Beta measures how much a stock moves per 1% swing in Bitcoin, so a beta of 1.5 implies the stock rises about 1.5% when Bitcoin rises 1%, and falls further when Bitcoin falls. Betas and correlations are calculated over 90 trading days.
| Asset | 2026 return | Drawdown from 2026 high | 30-day realized vol | BTC beta | BTC correlation |
|---|---|---|---|---|---|
| BTC | -29.5% | -36.4% | 37.6% | 1.00 | 1.00 |
| ETH | -42.2% | -48.8% | 64.5% | 1.25 | 0.90 |
| COIN | -26.8% | -35.3% | 68.4% | 1.26 | 0.75 |
| HOOD | -0.3% | -8.5% | 80.0% | 0.96 | 0.58 |
| CRCL | -18.5% | -51.4% | 89.9% | 1.18 | 0.55 |
| BLSH | -32.5% | -43.6% | 80.6% | 0.89 | 0.58 |
| MSTR | -33.7% | -48.6% | 81.8% | 1.59 | 0.85 |
| GLXY | +10.0% | -28.3% | 78.8% | 1.44 | 0.71 |
| MARA | +38.1% | -16.5% | 68.2% | 1.20 | 0.65 |
| RIOT | +74.5% | -22.9% | 70.8% | 1.07 | 0.56 |
| CLSK | +24.7% | -32.9% | 76.0% | 1.23 | 0.67 |
Strategy is the one name where the Bitcoin proxy label fits. Its beta of 1.59, combined with a correlation of 0.85, describes leveraged Bitcoin exposure delivered through an equity. The stock behaved accordingly during the selloff, falling further than the coin in both the year-to-date figures and the drawdown from its 2026 high.
Coinbase comes closest to a balanced Bitcoin trade. It fell slightly less than BTC this year at -26.8%, with a beta of 1.26 and the second-highest correlation to Bitcoin in the group. Even so, its realized volatility ran nearly double Bitcoin’s, and the stock still trades 60.6% below its July 2025 record of $419.78. Anyone who bought near that top lost more than a holder who bought Bitcoin at its October 2025 record of $126,223.
Circle is the best example of equity risk masquerading as crypto exposure. Its correlation with Bitcoin is the lowest in the group, and its 90-day volatility is 103.6%, the highest. The reason showed up on June 30, when CRCL dropped 17.5% in a single session after the debut of Open USD, a rival stablecoin backed by more than 140 companies, including Coinbase, Stripe, Visa, Mastercard, and BlackRock.
Bitcoin’s price had almost nothing to do with that move. Stablecoin issuance is a payments and competition business, and Circle’s shareholders absorbed a competitive shock unique to that business.
Robinhood goes the other way and proves the same point. The brokerage is roughly flat for the year at -0.3%, with the shallowest 2026 drawdown in the group at 8.5%, because crypto is one slice of its much larger stock, options, and derivatives business. Diversification cushioned the slide somewhat, but HOOD delivered only a small fraction of the crypto exposure a buyer might have wanted on the way up.
The miners are the strangest result in the dataset. Riot gained 74.5% this year, MARA 38.1%, and CleanSpark 24.7%, while Bitcoin fell 29.5%. That outperformance came from the sector’s ongoing conversion into AI and high-performance computing landlords, a shift CryptoSlate has tracked as miners signed tens of billions of dollars in compute contracts and sold down their Bitcoin treasuries.
Their betas still sit above 1, so they swing with Bitcoin on any given day, though the year’s total gains came from AI hosting revenue that has nothing to do with the coin’s price.
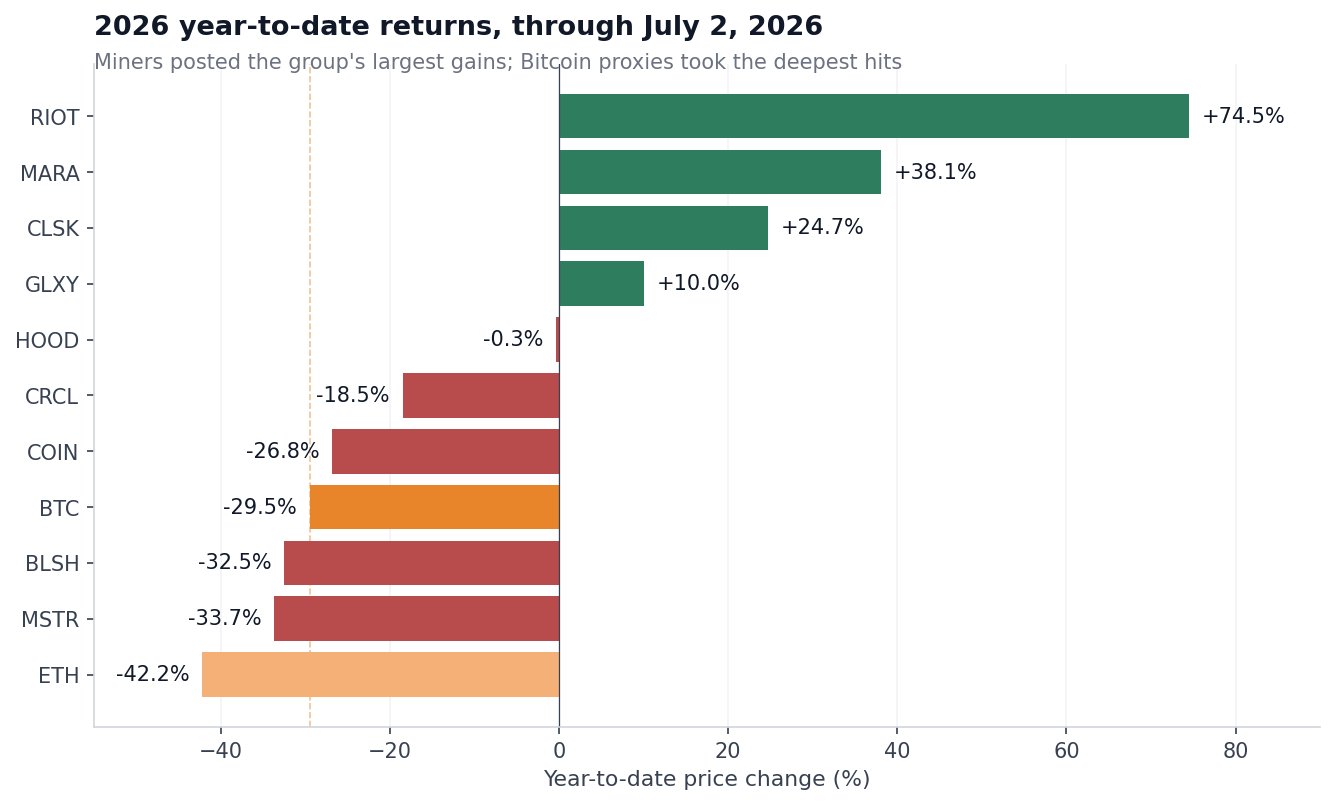
The Bitcoin comparison base is far from calm. Volmex’s BVRV index of Bitcoin’s 30-day realized volatility bottomed at 24.5 in late May and climbed back to 41.6 by early July, after peaking at 68.7 during a separate February episode. Most of the stocks doubled that reading anyway.
Bitcoin holders face price risk. Equity holders in a Bitcoin-linked company face that plus everything else that can happen to a company: dilution, loss of the premium the market once paid, financing pressure, and changes to the capital plan.
Strategy experienced all of it inside a single month. In late June, the firm’s mNAV, or multiple of net asset value, fell below 1 for the first time. mNAV compares a company’s enterprise value (its market capitalization plus debt, minus cash) to the market value of Bitcoin on its balance sheet.
A value below 1 means the market values the entire business at less than the cash it holds. Strategy held 847,363 BTC as of its June 22 disclosure, worth roughly $50 billion at the moment mNAV fell through the threshold.
Falling below 1 breaks the model that built the company. Strategy’s flywheel, the self-reinforcing cycle at the core of the business, depended on the stock trading at a premium to the value of its Bitcoin holdings.
That premium allowed Michael Saylor’s team to issue new common and preferred shares at prices above the underlying coin’s value, then use the proceeds to buy more Bitcoin, adding Bitcoin-per-share for existing holders on every raise.
Below an mNAV of 1, the same process destroys value, because the company would be selling Bitcoin exposure at a discount to the coins it already holds. CryptoSlate reported on this in January when the treasury sector split into premium and discount operators.
Strategy’s market capitalization stood at $29.54 billion at the end of June, less than half its 2024 peak above $71 billion, and all four of its preferred stock series, separate share classes that pay fixed dividends and helped fund Bitcoin purchases, traded near record lows.
The company’s response confirms how different equity risk is from coin risk. On June 29, Strategy announced a share buyback program and authorized up to $1.25 billion in Bitcoin sales to build a liquidity cushion for preferred dividends and interest expenses. That came weeks after its first Bitcoin sale since 2022, a small 32 BTC disposal on June 1.
Shares closed 12.6% higher on the announcement, snapping an eight-day losing streak. The largest corporate holder of Bitcoin now has board-approved authority to sell into a weak market because its financing structure requires cash that the equity market has stopped providing on the old terms. A direct Bitcoin holder is not tied to that constraint.
That is the context for ARK’s buying. On June 25 alone, Wood’s funds added 35,023 Robinhood shares worth about $3.27 million alongside fresh Coinbase, Circle, and Bullish positions as all four crypto stocks fell.
Wood pairs the purchases with a seven-figure long-term Bitcoin target, and at current prices, her funds are accumulating businesses at steep discounts to 2025 valuations.
The data tells us what those businesses actually are: MSTR is levered Bitcoin exposure with dilution risk attached; Circle is a payments company in a stablecoin market-share fight; and Robinhood is a diversified brokerage with a crypto sideline. Buying all of them is a portfolio bet across different business models, with crypto exposure ranging from amplified to almost incidental.
Every stock in the group has an investment case on its own terms. Coinbase beat Bitcoin this year, Robinhood protected capital, and the miners posted the best returns in the sector.
But does the equity wrapper reduce risk relative to owning Bitcoin directly? Across nine names, the wrapper either amplified Bitcoin’s swings or added a second layer of company-specific risk with little to do with the coin’s price.
The crypto stocks that protected capital this year did so by growing revenue streams with their own drivers, meaning AI hosting contracts, brokerage flows, and payments products, with Bitcoin a smaller input to the outcome.
Crypto analyst Kevin, known online as Kev Capital TA, said he has started buying Dogecoin again after the memecoin fell back to what he described as a major long-term support zone near $0.095. In a video published April 20, Kevin argued the level matters because it aligns with the measured move target of Dogecoin’s weekly bear flag and with a price area that has repeatedly acted as both support and resistance across prior cycles.
Kevin said Dogecoin’s corrective move from its December 2024 cycle high near $0.49 has now largely fulfilled the downside target he had been watching for months. “If you just take the measured move target of the bear flag pattern, you’re basically sitting at the exact same price of what the measured move target is,” he said, placing that target at about $0.095.
That level, in his view, is not just a technical target but a historically important zone. Kevin pointed back to August 2024, when Dogecoin bottomed near the same area before rallying sharply in the fourth quarter, and to earlier periods in 2022, 2023 and early 2024 when the band acted as resistance, support, or a breakout-retest level. “This is a major level, right? This is a major major zone,” he said. “You found support here back in January 2024 before we legged up to the 23 cents level. You found the support here again in the summertime of 2024 before we legged up to 49 cents.”
Even so, Kevin stopped well short of calling a confirmed macro bottom in Dogecoin. His broader framework remains centered on Bitcoin, which he repeatedly described as the market’s primary signal. “Altcoin charts are not living in their own world,” he said. “Bitcoin is the captain. Bitcoin is the king. Bitcoin is the queen. Whatever way you want to put it, whatever way you want to slice and dice it, that’s the way the market goes.”
That point shaped the rest of his Dogecoin thesis. Kevin said he has started a position at current levels, but only as part of a gradual accumulation plan that depends heavily on how Bitcoin behaves in the weeks ahead. “I have in our private group started a position in Dogecoin down at these levels,” he said. “My plan is to continue to allocate into it if I get the opportunity to. If Bitcoin were to leg lower … then I would hope to get the opportunity to then slowly, very slowly allocate into Dogecoin all the way down into this $0.08, $0.07, $0.06, maybe $0.05.”
His near-term read is constructive, but only in a limited sense. He pointed to improving weekly money flow, buy signals, upside movement in weekly stochastic RSI, and a bullish turn in LMACD on lower time frames as evidence that the market is in a late-winter, early-spring countertrend rally. But he argued Dogecoin still faces a heavy technical ceiling before traders can talk about a real trend reversal.
On the weekly chart, Kevin said Dogecoin needs to reclaim the 21-week EMA and 20-week SMA around the low-$0.11 area, while higher resistance bands sit around $0.136, $0.147 and $0.161 depending on the moving average used. On the monthly chart, he said the picture is even less convincing. Dogecoin, according to Kevin, closed below the 100 EMA on the monthly for the first time in its history, while monthly momentum, money flow and LMACD have yet to show the kind of reset he associates with the end of a bear market.
“Treat it as a bear market for now,” he said. “This countertrend rally is nice, but for now, it’s still just a countertrend rally on the crypto market until proven otherwise.”
That leaves Dogecoin in a familiar place: attractive enough for selective accumulation, but still dependent on Bitcoin to validate any broader reversal. Kevin said he expects the “true bottom” for the cycle to arrive sometime between July and October if the standard four-year pattern continues. Until then, his message was less about chasing Dogecoin itself than about watching the asset that still sets the tone for everything around it.
At press time, DOGE traded at $0.09558.
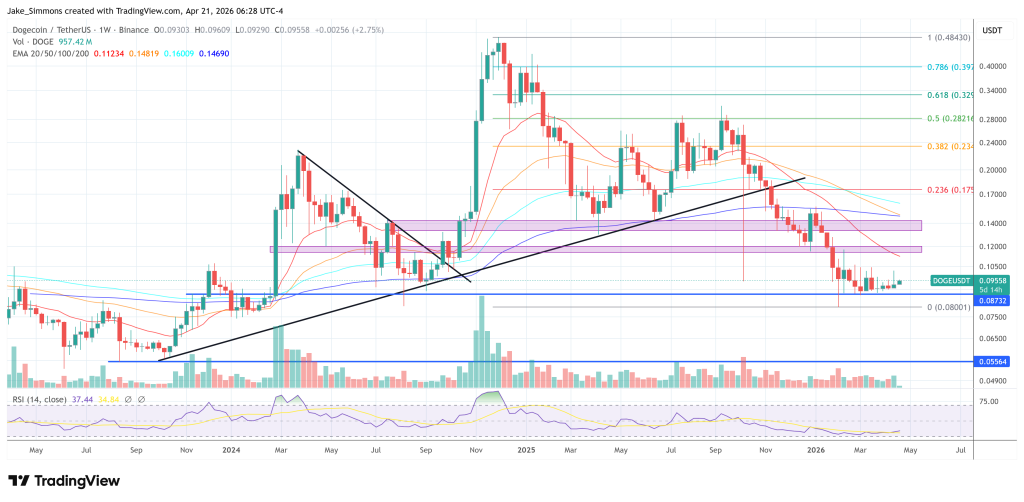
Featured image created with DALL.E, chart from TradingView.com

Retail investors have been scooping up Bitcoin after it slipped below $70,000, but whale activity suggests the price could still head lower if past patterns repeat, according to crypto sentiment platform Santiment.
“The moment Bitcoin hit $74k, these key stakeholders began taking profit,” Santiment said in a report on Friday.
Santiment explained that whales — those holding between 10 and 10,000 Bitcoin (BTC) — “accumulated heavily” between Feb. 23 and Mar. 3, when Bitcoin was trading between $62,900 and $69,600.
Since Wednesday, when Bitcoin climbed past $70,000 and touched $74,000, the cohort has offloaded around 66% of their recent purchases, Santiment said. Meanwhile, retail investors — those holding below 0.01 Bitcoin — have been increasing their positions.
“When retail buys while whales sell, it typically signals that the correction is not yet over,” Santiment said. Bitcoin is trading at $67,984 at the time of publication, according to CoinMarketCap.
Bitcoin’s price decline led the Crypto Fear & Greed Index to fall 6 points, pushing it further into “Extreme Fear” territory with a score of 12 on Saturday.
MN Trading Capital founder Michael van de Poppe shared a similar outlook, saying a further decline is possible. “If Bitcoin doesn’t find support in this $67-68K region, then we’re likely going to retest the lows for liquidity before bouncing back upwards,” van de Poppe said in an X post on Friday.
The decline coincided with US-based spot Bitcoin ETFs posting their largest outflow day since Feb. 12, with a total of $348.9 million in net outflows across the 11 ETF products, according to Farside data.
Related: Trump’s National Cyber Strategy pledges to support crypto and blockchain
Bitcoin’s price fell as low as $60,000 on Feb. 6 during its downtrend from the October all-time high of $126,000 before showing a modest recovery. Economist Timothy Peterson suggests this level could be the floor for the time being.
“This valuation level has always marked a bottom for Bitcoin. About 99.5% chance it stays above $60k,” Peterson said in an X post, referring to the Bitcoin Price to Metcalfe Value chart.
Magazine: The debate over Bitcoin’s four-year cycle is over: Benjamin Cowen

The December 9–10 FOMC meeting is drawing intense attention as traders price in a possible 25 bps rate cut, a move that could bring a short burst of liquidity back into risk assets. The crypto market is still moving with caution, slipping about 1.1% ahead of the announcement. Still, some crypto whales are positioning early.
A handful of tokens are seeing a clear pickup in whale accumulation, with some showing rebound or breakout structures on their charts. This piece lists three of them.
Aster is showing one of the strongest accumulation signals from crypto whales in the past 24 hours. The token is down 4% today and more than 10% over the last month, yet whales have added 11.61% to their holdings, increasing their stash to 44.76 million ASTER at a price near $0.93. This means Aster whales added roughly 4.67 million tokens, priced at almost $4.34 million at current prices.
Sponsored
Sponsored
Accumulation into weakness is often a sign that whales expect a shift in conditions once the FOMC meeting outcome is known.
Want more token insights like this? Sign up for Editor Harsh Notariya’s Daily Crypto Newsletter here.
The ASTER price chart offers part of the explanation.
Between November 3 and December 7, Aster’s price formed a higher low, while the RSI (Relative Strength Index) — which tracks momentum — printed a lower low. This creates a hidden bullish divergence, a structure that often signals trend continuation and a fade in selling pressure.
The same pattern appeared between November 3 and November 29, and Aster rallied about 22% afterward. Crypto whales may be placing early bets on a similar reaction if market sentiment turns risk-on after the rate decision.
The ASTER price is also moving inside a tightening triangle pattern, which usually reflects buyer-seller indecision before a larger move. The first level to reclaim is $1.01. A break above that zone opens the path toward $1.08, and a stronger move may push the token toward $1.40.
Sponsored
Sponsored
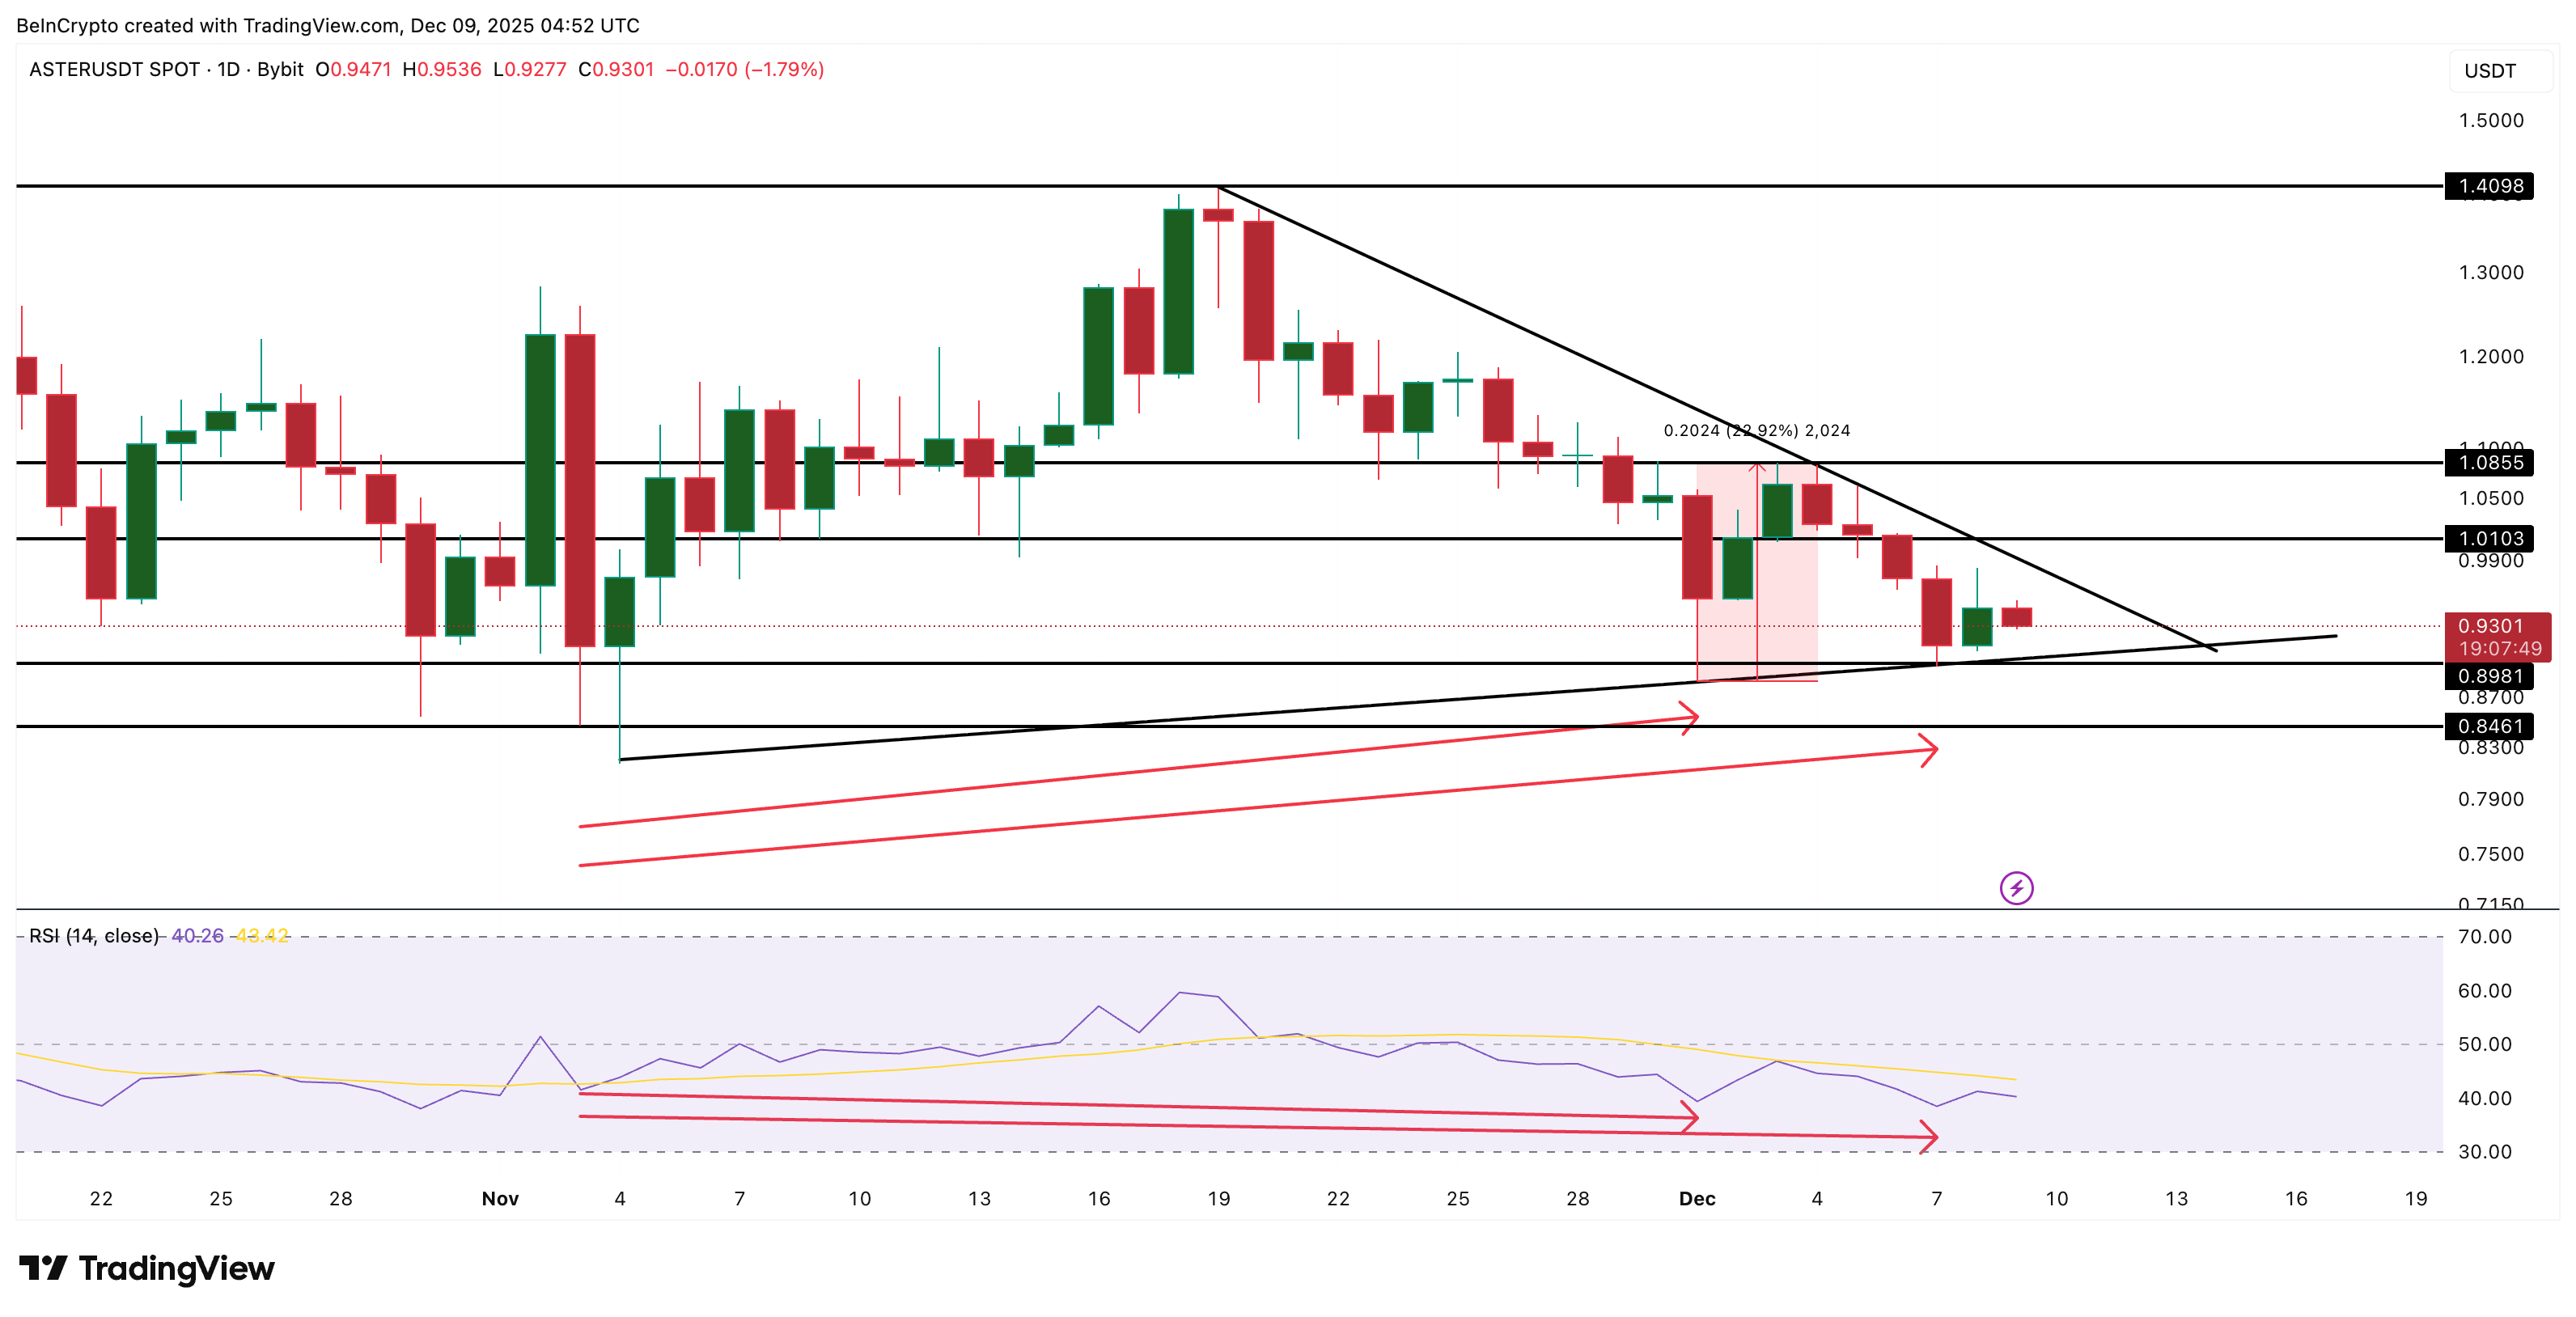
But this structure fails if Aster loses $0.89, which would expose $0.84 and invalidate the trend-continuation setup whales appear to be watching.
Pippin is the second token seeing clear accumulation from crypto whales ahead of the December FOMC meeting. Whales expanded their holdings by 18.2% over the past seven days, bringing their stash to 350.03 million PIPPIN. This means they added roughly 53.9 million PIPPIN, worth about $9.75 million at current prices.
Top 100 addresses (mega whales) have also added to their positions, increasing their holdings by 3.96%. When both whales and major holders accumulate during a cooling phase, it often signals confidence that a new move may form soon.

Sponsored
Sponsored
The PIPPIN price action supports that view.
Pippin is up 3.06% in the last 24 hours after a quiet week, yet it remains more than 400% higher over the past month. The current structure resembles a bull flag, a continuation pattern that appears when a strong rally pauses. Whales positioning into this consolidation suggests they expect volatility to rise after the FOMC decision.
PiPPIN first needs to reclaim $0.21 and $0.26 to confirm a strong flag breakout. The breakout requires a move above $0.34, which has acted as a firm resistance since Pippin topped. At present, the PIPPIN price has broken out of the upper trendline of the flag, but a clean daily candle close above $0.21 is needed for confirmation.
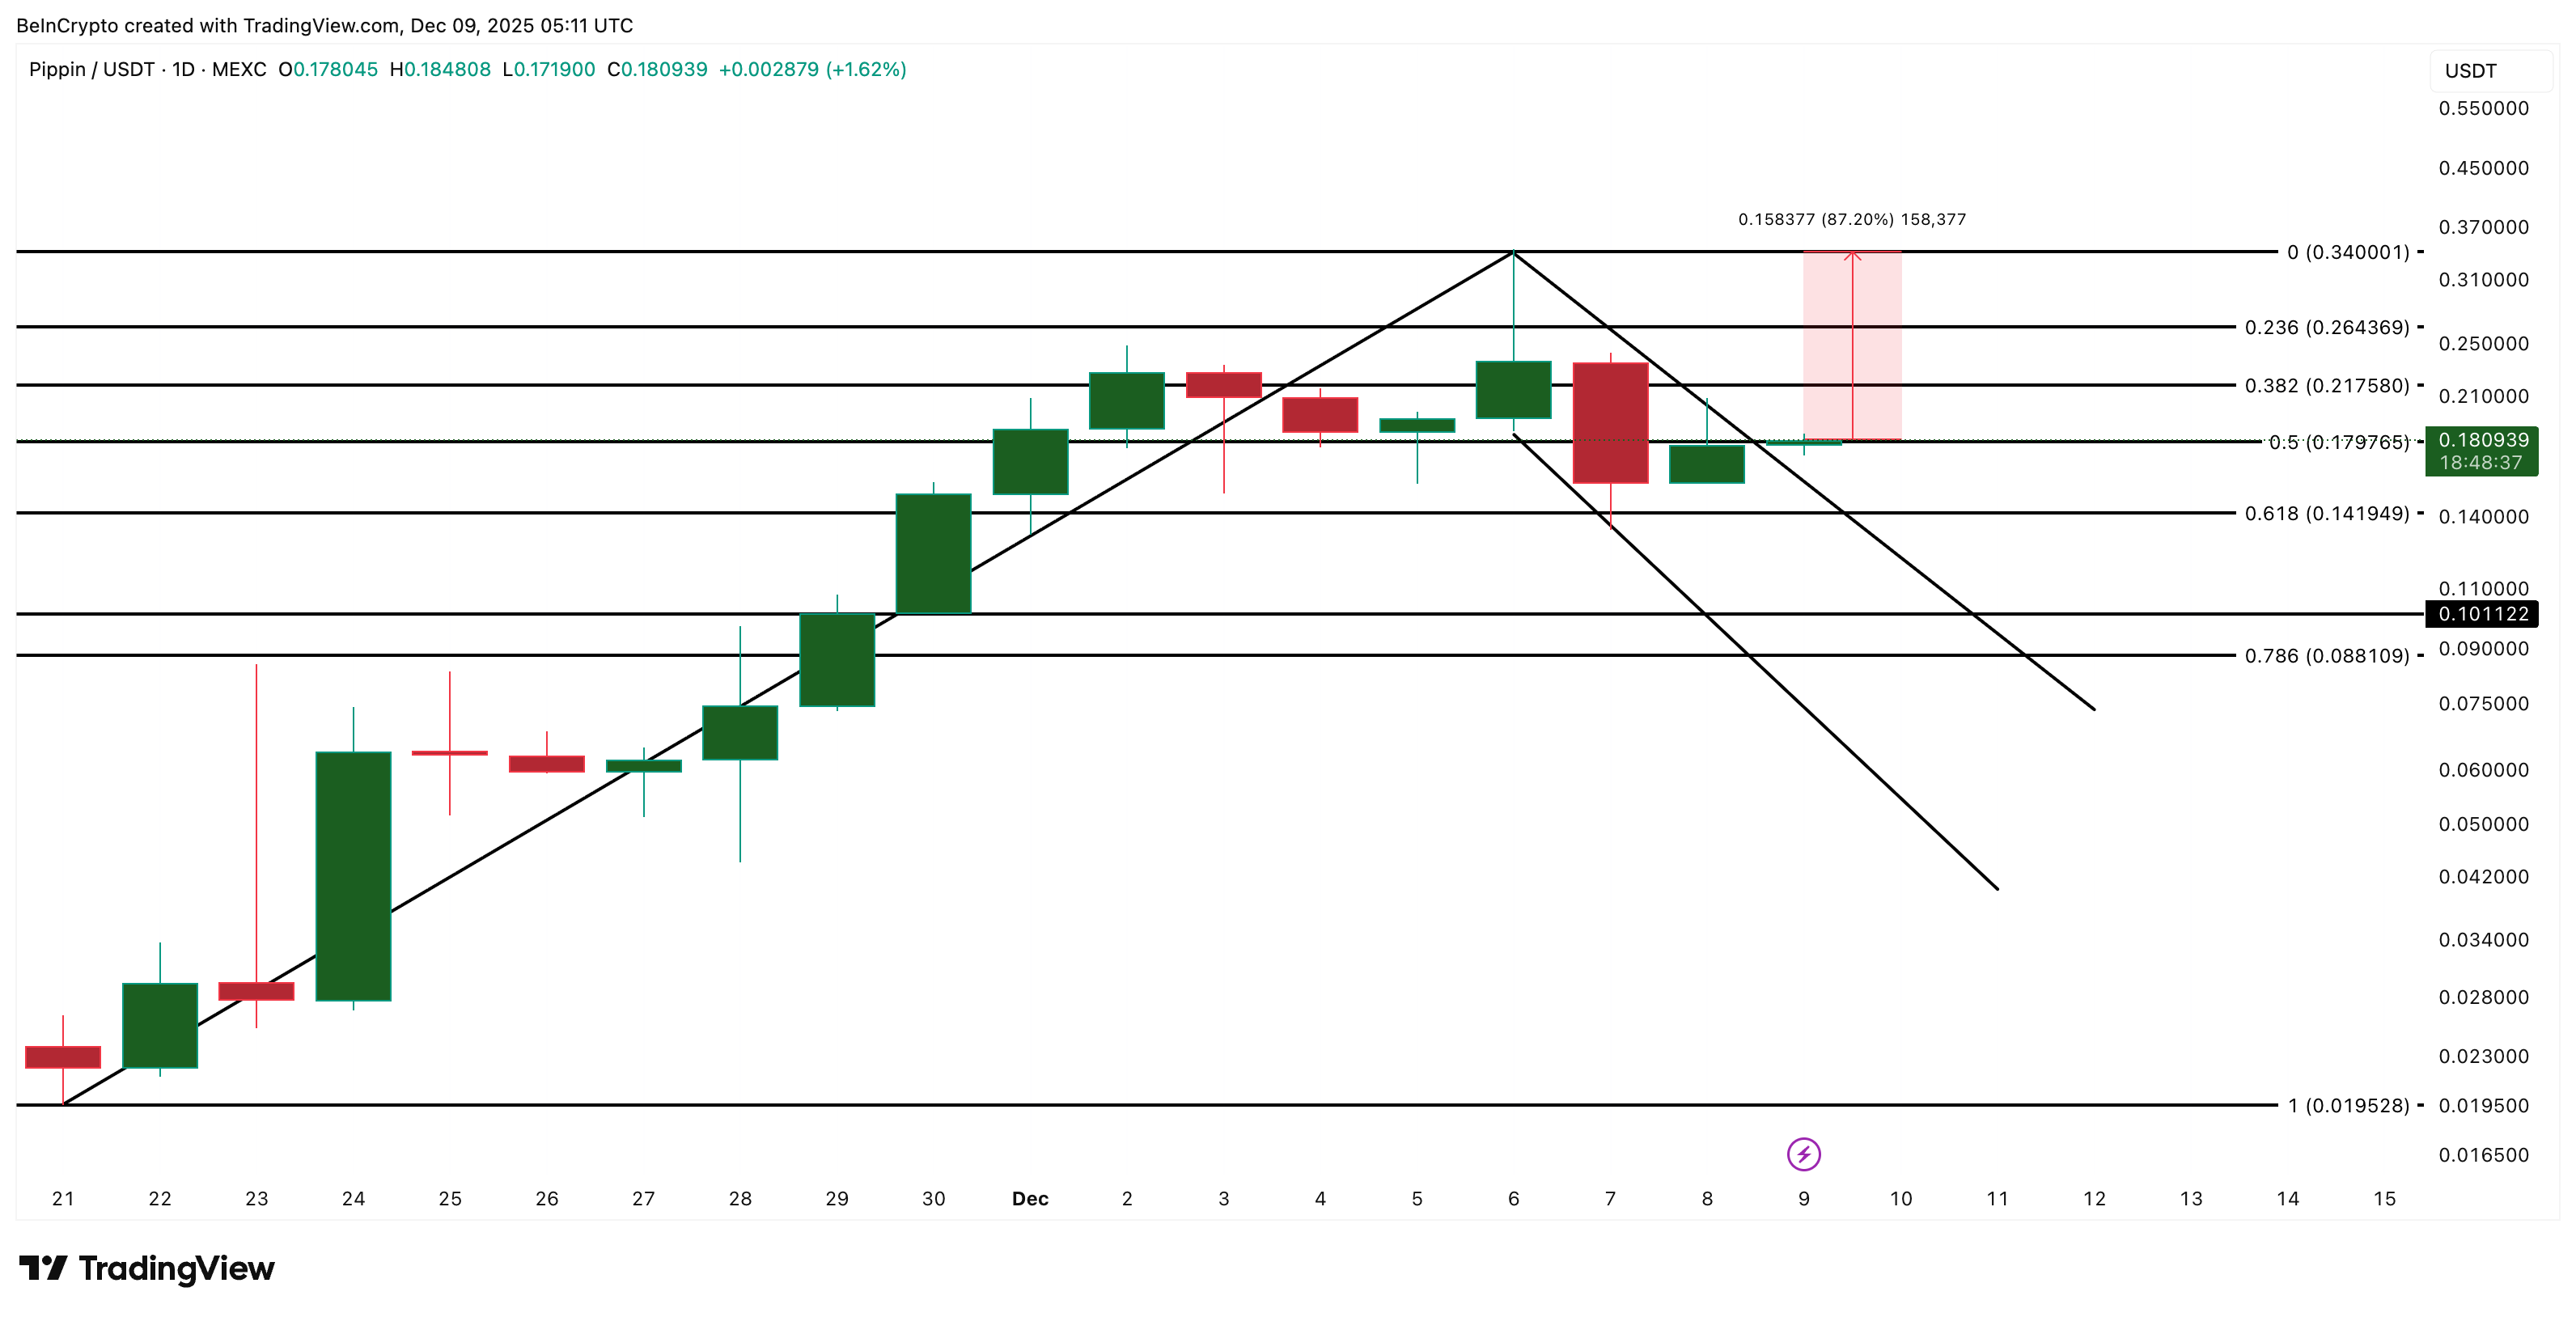
If PIPPIN slips below $0.14, the structure weakens, and a fall under $0.10 could break the flag pattern completely, exposing deeper support near $0.08. For now, whales appear to be treating this consolidation as an opportunity rather than exhaustion.
Sponsored
Sponsored
Chainlink is the third token seeing steady crypto whale interest ahead of the December FOMC meeting and expected rate cuts. Over the past seven days, LINK whales increased their holdings by 28.93%, raising their stash to 3.78 million LINK. At the current price, this added position is worth roughly $11.5 million.
Top-100 addresses also increased their supply by 0.62%, while exchange balances dropped by 3.09%. These usually hint at increased demand from both whales and retail.

Whale conviction aligns with what the 12-hour chart is showing. LINK is up 12.5% this week, hinting at a short-term uptrend. Between December 7 and 9, the price formed a higher low, but the RSI made a lower low, which is a hidden bullish divergence. Hidden bullish divergence often points to trend continuation because it shows selling pressure is weakening even as the price holds higher levels.
For this structure to play out, LINK needs a clean break above $13.72 with a solid 12-hour close. The more important barrier sits at $14.19, which rejected LINK earlier this week. If this level breaks, LINK could stretch toward $14.95, and above that, the next major resistance is near $16.25.
If the market turns risk-off after the FOMC meeting, the first support to watch is $12.97 at the 0.618 Fibonacci zone. Losing this level exposes $11.75, which has acted as a strong floor since December 1.
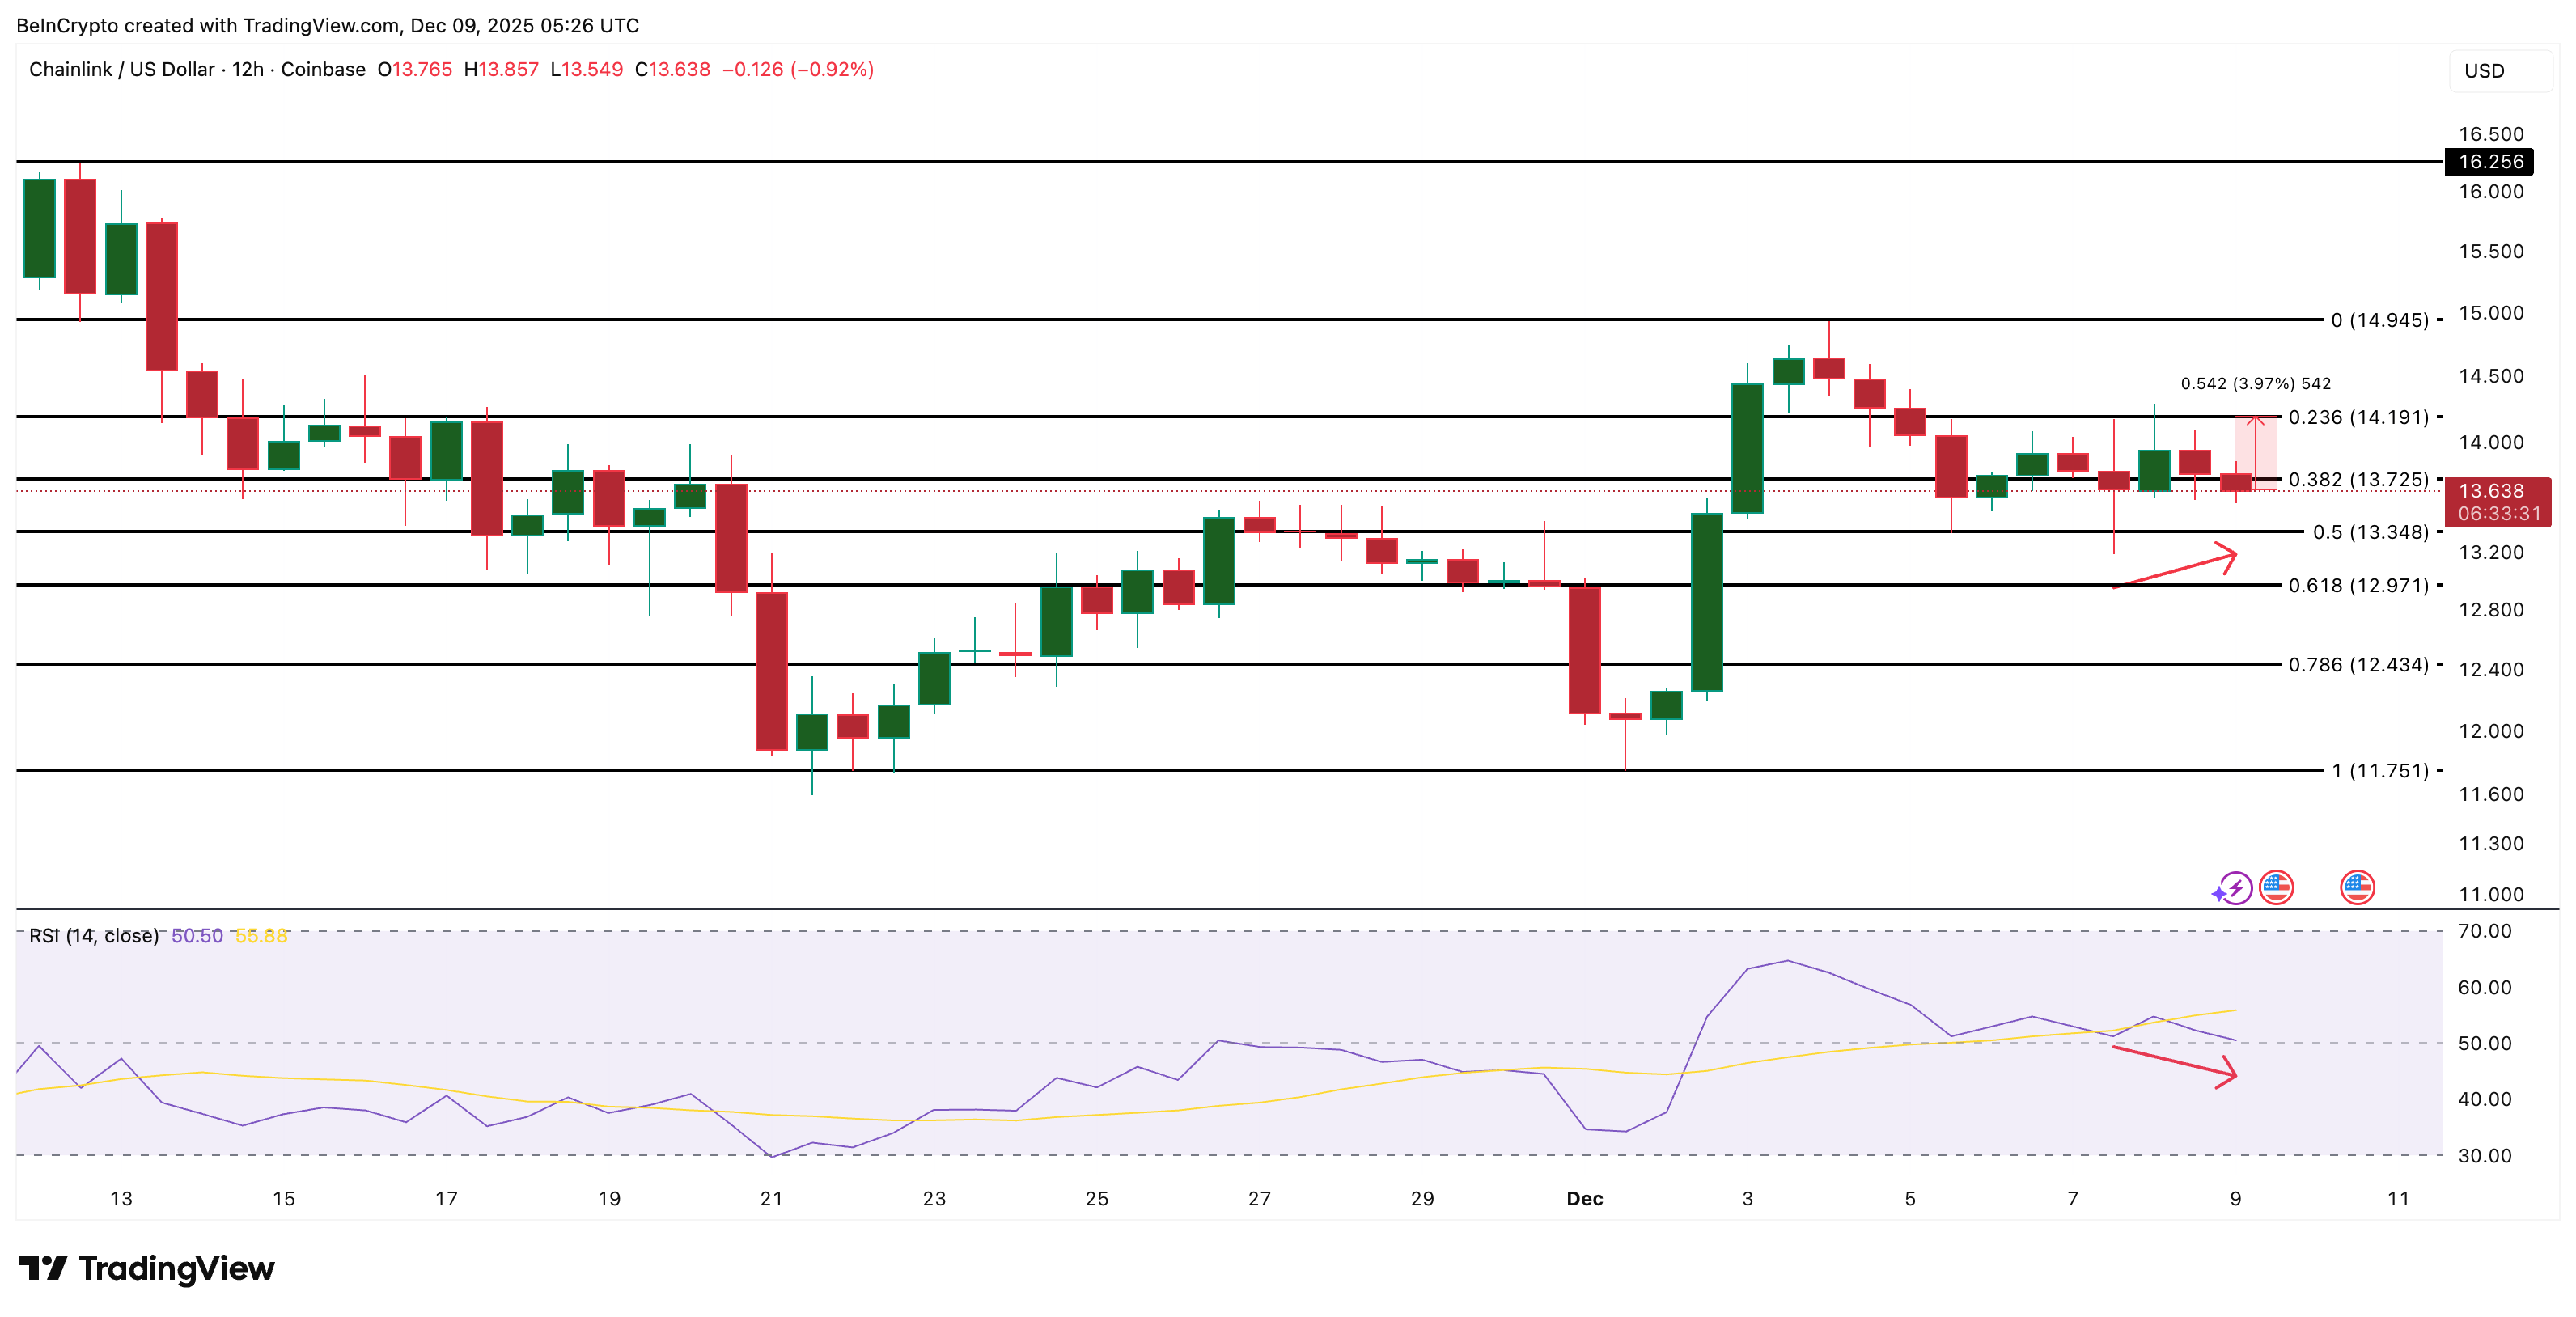
Whales are adding aggressively while LINK prints hidden bullish divergence, creating a setup where even a small boost in market liquidity from the FOMC outcome can extend the ongoing uptrend.

Start every day with the top news stories right now, plus original features, a podcast, videos and more.

BitMine’s large buy and a string of public warnings have left markets watching Ethereum closely this week. Big moves were made during the sell-off, and firms and investors are now weighing whether those buys mean confidence or simply a bet on a rebound.
According to onchain data from Arkham Intelligence and the tracker ‘BMNR Bullz’, BitMine Immersion Technologies bought a total of 379,271 ETH in three separate purchases: 202,037 ETH after the weekend crash, 104,336 ETH on Thursday, and 72,898 ETH on Saturday.
Reports have disclosed the haul is worth almost $1.5 billion. The purchases have not been officially confirmed by BitMine, but the transfers were visible on public ledgers.
BitMine is reported to hold more than 3 million ETH, which equates to about 2.5% of the entire supply, and that stash was valued at roughly $11.7 billion at recent prices.
🚨 MASSIVE ETHEREUM ACCUMULATION
Bitmine just went ALL IN on $ETH scooping up a total of 379,271 ETH ($1.48B) during the dip! 👀
💰 +72,898 ETH ($281M) yesterday’s dip
💰 +104,336 ETH ($417M) 3 days ago
💰 +202,037 ETH after the weekend crashTom Lee wasn’t joking when he said… pic.twitter.com/oiyhLO79wk
— BMNR Bullz (@BMNRBullz) October 18, 2025
Based on reports, the firm has set a goal of reaching 5% of supply and only began building the treasury in early July when Ether was near $2,500.
Tom Lee of Fundstrat has also been buying — he said he purchased $1.5 billion worth of Ether since the market crash — signaling that some large players see long-term upside.
Reports say Lee warned that the hype around digital asset treasuries, or DATs, may be fading, with many DATs trading at or below their net asset value (NAV).
Research firm 10x Research reported that several major DATs were near or under NAV. That has led investors to ask whether the trading discounts reflect lasting trouble or a brief market reset.
Huobi founder Li Lin is reportedly raising about $1 billion to put into an Ether treasury, which shows some firms still want exposure despite the cheap trading levels.
According to Lee, Ethereum could “flip” Bitcoin in a way he compared to how Wall Street and equities overtook gold after 1971. He also warned investors are still “licking their wounds” from a record leverage flush.
Markets are down 15% from the October 7 high, while gold has eased about 3% from its peak. Those moves are shaping where big holders place their bets.
Over the weekend I witnessed something every crypto investor should pay attention to. Ethereum, the largest blockchain in the world, got congested and fees skyrocketed past $1,000 just to process small transactions. That’s like paying a thousand-dollar toll to drive on a one-lane… pic.twitter.com/m9o1sRUQE0
— Kevin O’Leary aka Mr. Wonderful (@kevinolearytv) October 16, 2025
Meanwhile, based on social posts and blockchain data, Kevin O’Leary sounded the alarm about congestion on Ethereum after fees spiked during the sell-off.
He wrote that simple transactions briefly carried fees of as much as $1,000, calling attention to limits in handling sudden demand.
Etherscan data showed average daily gas prices hit a nine-month high last Friday, which was confirmed by market trackers.
Featured image from Unsplash, chart from TradingView

Editorial Process for bitcoinist is centered on delivering thoroughly researched, accurate, and unbiased content. We uphold strict sourcing standards, and each page undergoes diligent review by our team of top technology experts and seasoned editors. This process ensures the integrity, relevance, and value of our content for our readers.

Astra Nova, an AI-powered entertainment platform, has confirmed a major loss involving its newly launched RVV token.
In an October 18 statement, the project said the breach was linked to a compromised account belonging to one of its third-party market makers.
Sponsored
Sponsored
The team said the attacker struck soon after the token’s debut, exploiting a compromise in the market maker’s account.
Astra Nova did not disclose the total amount of tokens drained from the exploit.
However, blockchain analyst EmberCN estimated the loss at approximately $10.3 million.
The analyst said on-chain data shows that the attacker withdrew 860 million RVV tokens—about 8.6% of the total supply—from the project’s minting contract. These tokens were later exchanged for Tether’s USDT stablecoin.
The massive sell-off triggered an immediate market reaction. According to CoinGecko, RVV’s price plunged more than 50% within 24 hours, sliding from $0.26 to roughly $0.0103 as of press time.
EmberCN added that about $8.2 million of the proceeds were moved to two centralized exchanges, including Gate and KuCoin. Another $2 million remains in an on-chain wallet currently under observation.
Sponsored
Sponsored
Considering this, EmberCN questioned Astra Nova’s account of events, arguing that the transaction pattern does not resemble typical hacker behavior.
“Which hacker would convert stolen assets into USDT and hold onto them? And even transfer them directly to a CEX? USDT can be frozen, and going straight to a CEX—where are there hackers this foolish,” EmberCN wrote.
In response to the skepticism and the market crash, Astra Nova reaffirmed that it was a victim of an external compromise, not internal foul play.
The project announced plans to repurchase the same number of RVV tokens affected by the breach. The move aims to stabilize the token’s liquidity and reassure investors.
At the same time, the Astro Nova team also launched a 10% bounty program for anyone who returns the stolen assets to a verified recovery address.
The project’s team said it would not pursue legal action if the full amount is returned. It also described the offer as an opportunity to “close this peacefully.”
“If you return the full amount to the verified recovery address shared on our official channels, no further action will be taken, and the bounty will be transferred once confirmed by our forensics team,” the project stated.


